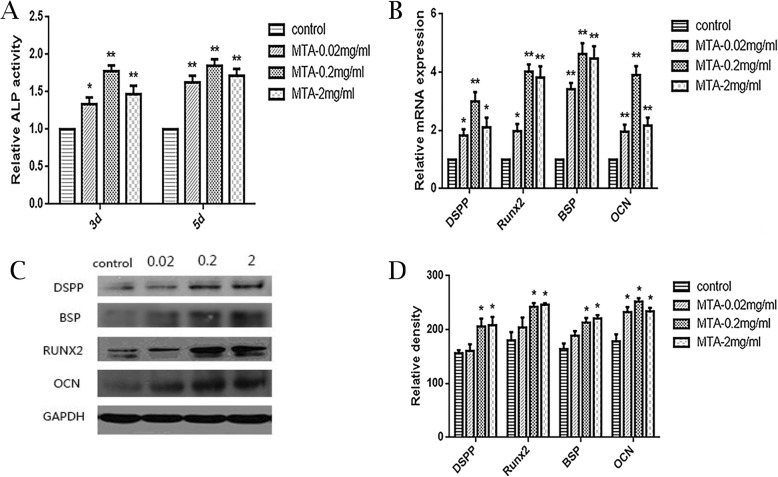
Fig. 3.
The effects of different MTA concentrations on osteo/odontogenic SCAP differentiation. a Alkaline phosphatase (ALP) activity in groups with different MTA concentrations (0, 0.02, 0.2, 2 mg/ml) on 3 d and 5 d. b Relative mRNA expression of DSPP, RUNX2, BSP and OCN in each group at 5 d. GAPDH served as a reference gene. c Protein expression of DSPP, RUNX2, BSP and OCN in different groups on 5 d. d Grayscale analysis of c. (*p < 0.05, **p < 0.01)

