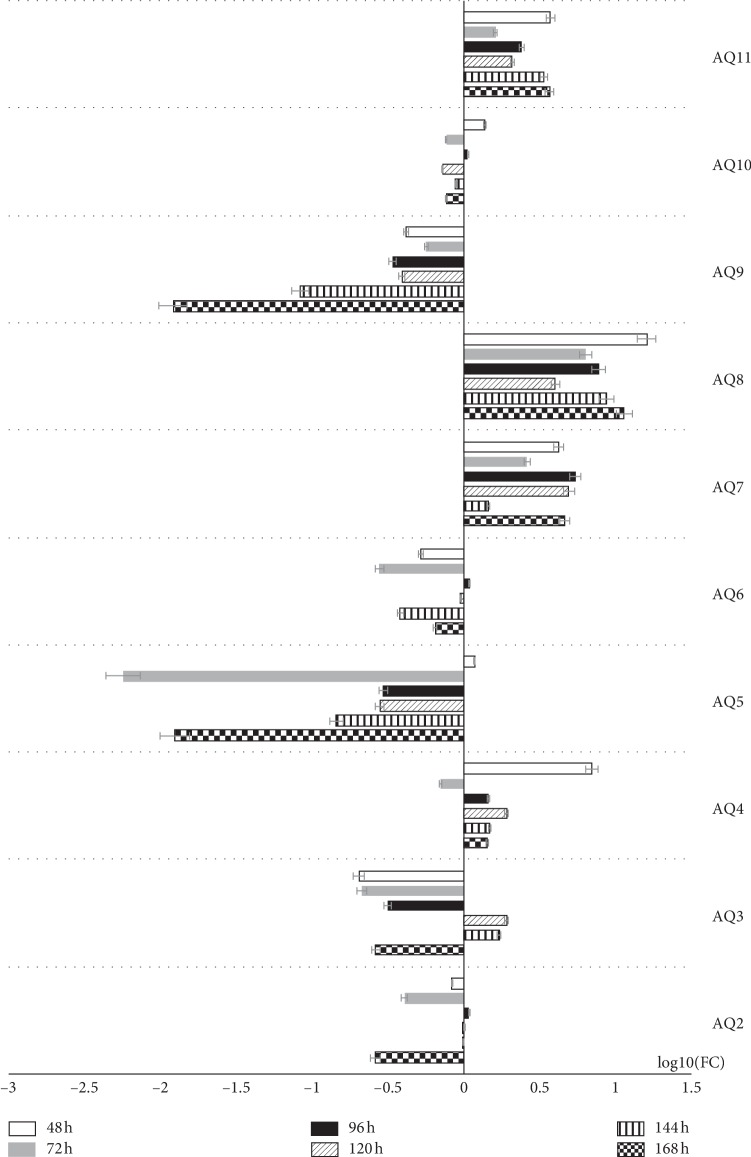
Figure 9.
The results of RT-qPCR (real-time-quantitative polymerase chain reaction) validation of analyzed genes, presented in the form of bar graph. All the fold changes were described in relation to the transcript levels at 24 h of primary culture. LogFC was used to present the data in order to improve the clarity and comparability of upregulation and downregulation results. Aquaporin: AQP2, AQP3, AQP4, AQP5, AQP6, AQP7, AQP8, AQP9, AQP10, and AQP11.

