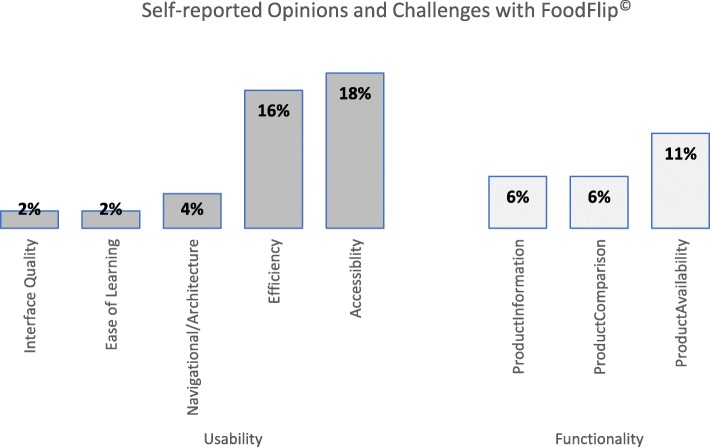
Fig. 5.
Self-reported opinions and challenges using the FoodFlip© app (n = 14381). Bars show the proportion of participants who provided written responses to the question: “What are some of the challenges you had when using the app?”. Data grouped by thematic analysis and analysed using chi-square test for proportions/counts and presented as % (number of participants)

