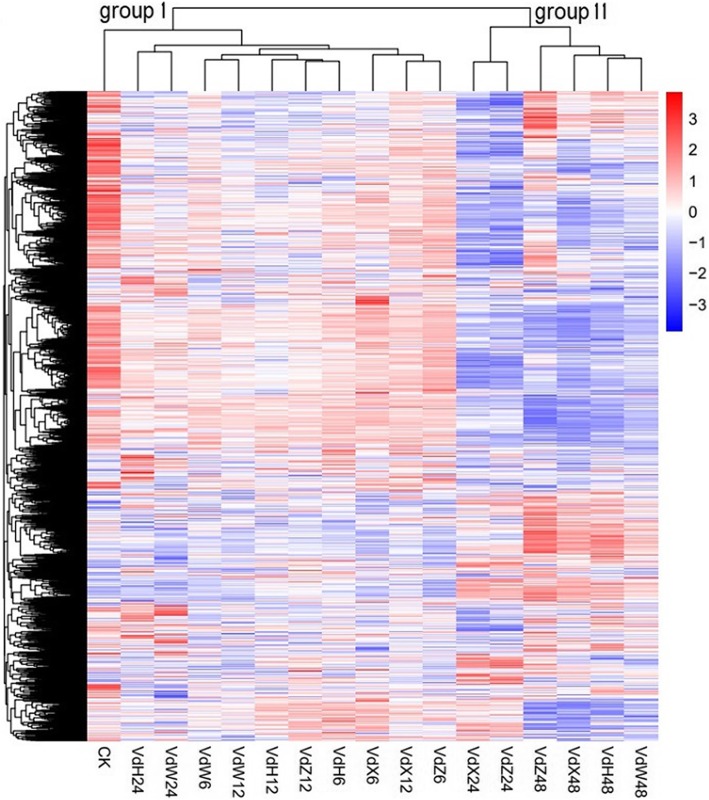
Fig. 3.
Hierarchical clustering of samples was performed using FPKM values of all genes identified in V. dahliae. The log10 (FPKM+ 1) values were normalized and clustered. Red and blue bands represent high and low gene expression genes, respectively. The color ranges from red to blue, indicating that log10 (FPKM + 1) is from large to small

