Fig. 4.
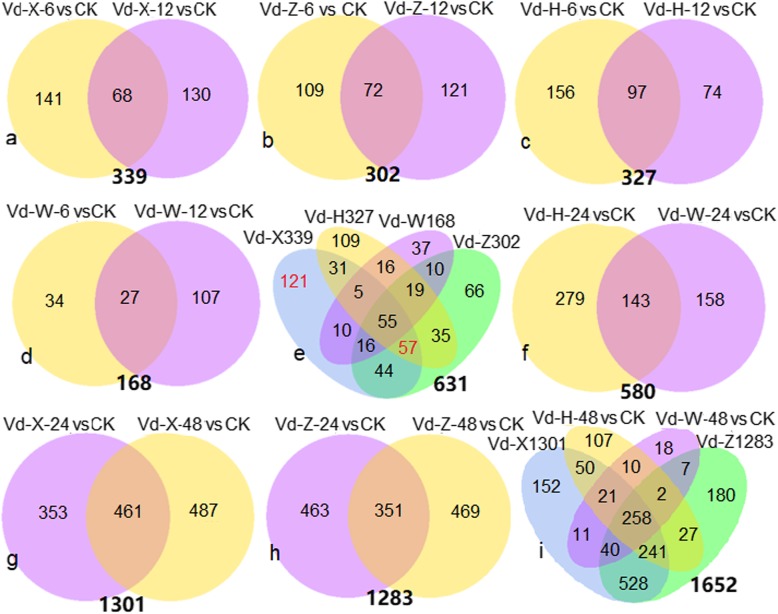
Overview of serial analysis of up-regulated DEGs identified in samples vs CK (Vd-0). a. Venn diagram of up-regulated DEGs in Vd-X-6 vs CK and Vd-X-12 vs CK. b. Venn diagram of up-regulated DEGs in Vd-Z-6 vs CK and Vd-Z-12 vs CK. c. Venn diagram of up-regulated DEGs in Vd-H-6 vs CK and Vd-H-12 vs CK. d. Venn diagram of up-regulated DEGs in Vd-W-6 vs CK and Vd-W-12 vs CK. e. Number of up-regulated DEGs identified in Vd-X vs CK (339), Vd-Z vs CK (302), Vd-H vs CK (327) and Vd-W vs CK (168). f. Venn diagram of up-regulated DEGs in Vd-H-24 vs CK and Vd-W-24 vs CK. g. Venn diagram of up-regulated DEGs in Vd-X-24 vs CK and Vd-X-48 vs CK. h. Venn diagram of up-regulated DEGs in Vd-Z-24 vs CK and Vd-Z-48 vs CK. i. Number of up-regulated DEGs identified in Vd-H-48 h (716), Vd-W-48 h vs CK (367), Vd-X vs CK (1201) and Vd-Z vs CK (1283). The Venn diagram in (a, b, c, d, e, f) represent serial analysis of up-regulated DEGs by comparing V. dahliae samples in the groupIwith CK. The Venn diagram in (g, h, i) represent serial analysis of up-regulated DEGs by comparing V. dahliae samples in the groupIIwith CK

