Figure 3.
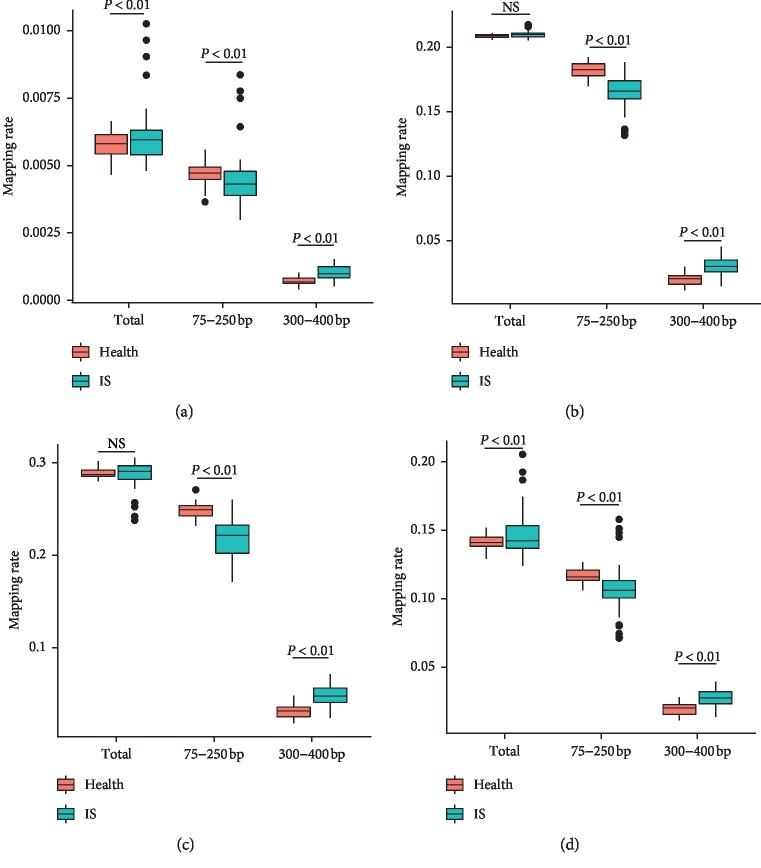
The distribution of cell-free DNA on the gene element. The ratio of fragments in each genome element was counted. Orange bar represents the ratio of fragments in the healthy group. Green bar represents the ratio of fragments in the IS group. P values were calculated by Student's t-test. (a) In CpG islands, (b) in Frag region, (c) in LINE region, and (d) in ALU region.

