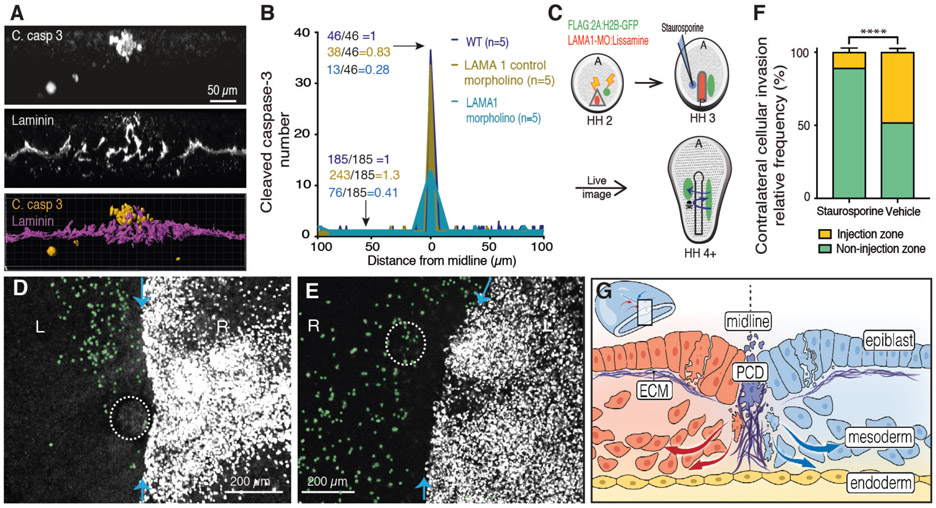
Fig. 4. Induced PCD restores ipsilateral gastrulation in ECM-depleted embryos.
(A) Transverse optical section, 10μm thickness, double-stained for cleaved caspase 3 (top) and laminin (middle), 3D reconstruction (bottom). (B) Quantification of cleaved caspase 3+ clusters at various distances from PS midline in WT embryos (yellow), control morpholino (blue) and with LAMA1 morpholino (aqua). Ratios represent total number of clusters at the midline and non-midline lateral regions. (C) Diagram of ipsilateral gastrulation rescue by staruosporine-induced PCD. (D) LAMA1 morpholino electroporated and staurosporine microinjected (dotted circle) embryo. Gastrulation pattern traced by Flag:2A:H2B-GFP (white), contralateral invading cells pseudocolored in green. Blue arrows, PS midline. (E) As in (D) but microinjected vehicle only (dotted circle). (F) Quantification of contralateral invasion suppressed by induced PCD. Injection zone vs non-injection zone (p<0.0001, n=3). (G) Model of PCD mediated regulation for ipsilateral gastrulation. Lm, laminin. C. Casp 3, cleaved caspase 3.

