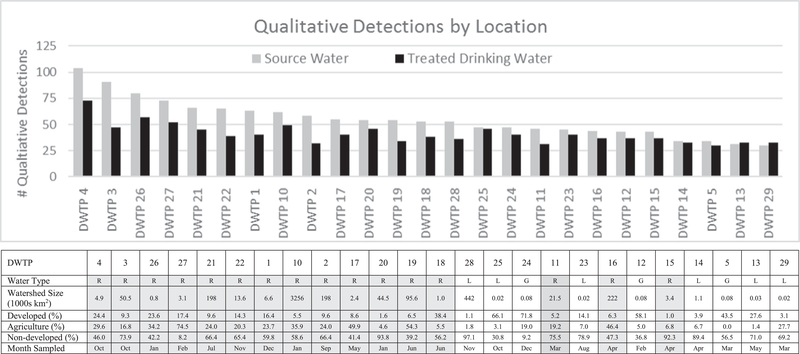
Fig. 2.
Qualitative detections of all Phase II analytes and watershed characteristics. The qualitative detections ranked according the number of source water analytes detected. The watershed characteristics table lists the type of source water (R, river or stream; L, lake or reservoir; G, groundwater (includes under the influence of surface water)), as well as size and use characteristics of the watershed.

