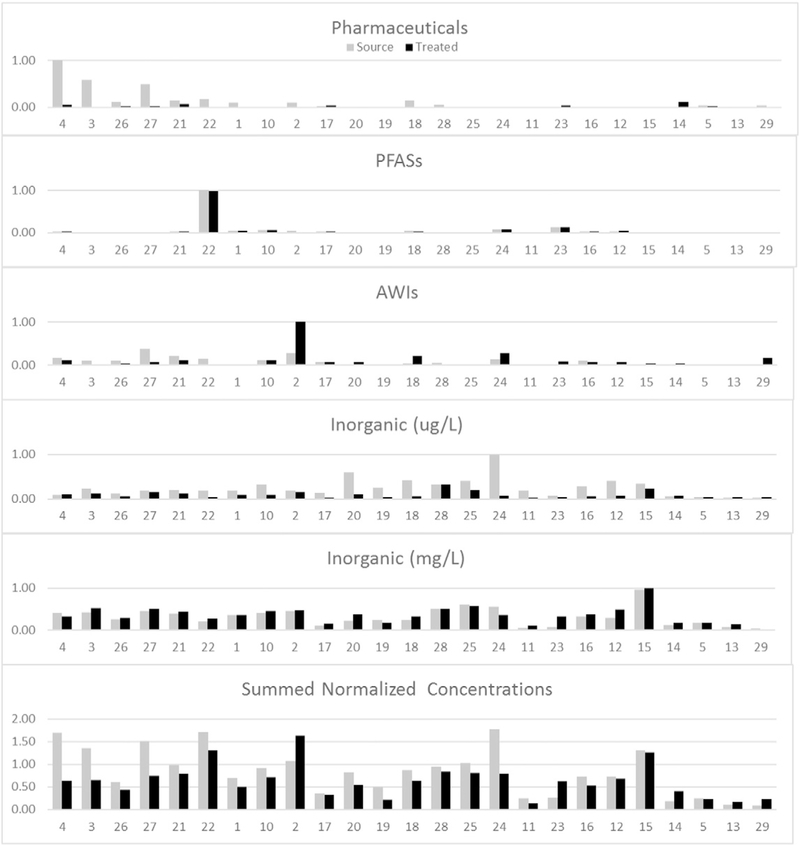
Fig. 5.
Normalized chemical concentrations. Concentrations in each chemical class were normalized to the location with the greatest concentration. The summed normalized concentration figure is the sum of the normalized concentrations of five chemical class subunits (pharmaceuticals, PFASs, AWIs, inorganics with μg/L units and inorganics with mg/L units).

