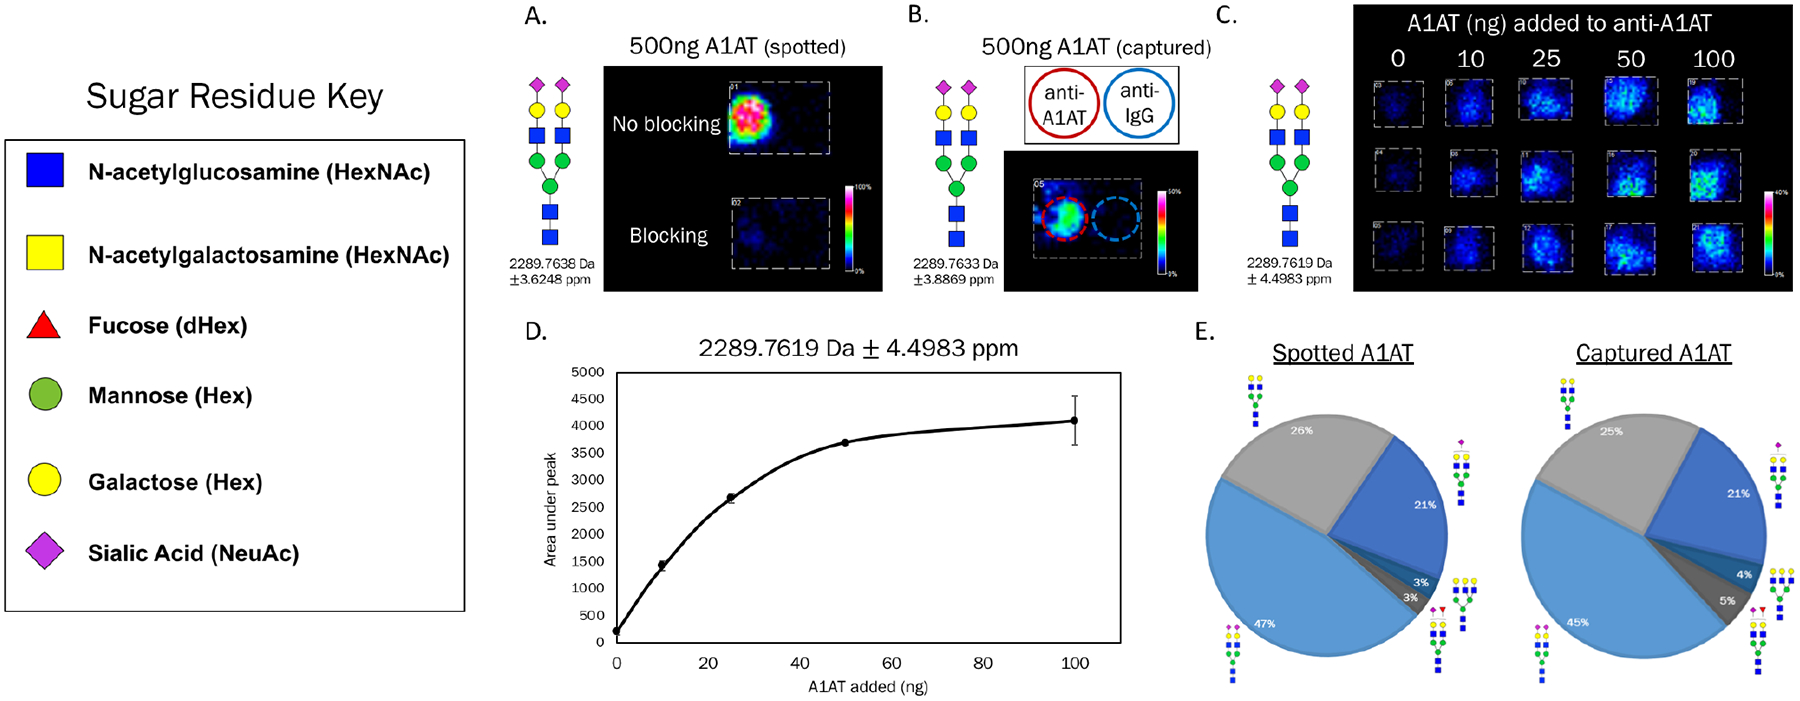
Figure 3.

N-glycan detection by MALDI MSI of immunocaptured A1AT. A) A1AT was spotted (1μL) to slide with and without blocking (1% BSA). Imaging data is from the most abundant N-glycan observed on A1AT, which is not seen on the blocked slide. B) A1AT was added in a 100μL volume to a well containing both anti-A1AT and anti-IgG as adjacent spots, red and blue circles added for emphasis of antibody location. C) A dilution series of A1AT standard solutions (100μL) were added in triplicate to anti-A1AT. N-glycan signal is seen at antibody spots with an increase in color intensity observed as more glycoprotein was present. D) Quantifications of imaging data in C were performed by calculating the area under the peak for each sample. Each data point represents the average +/− standard deviation of three samples. E) Comparison of A1AT spotted directly to the slide versus antibody-captured. N-glycan profiles showed strong agreement. Percentages of each N-glycan specie were calculated by area under the peak divided by the total of all N-glycan peak areas. The proposed structures for the most abundant N-glycans on A1AT are shown.
