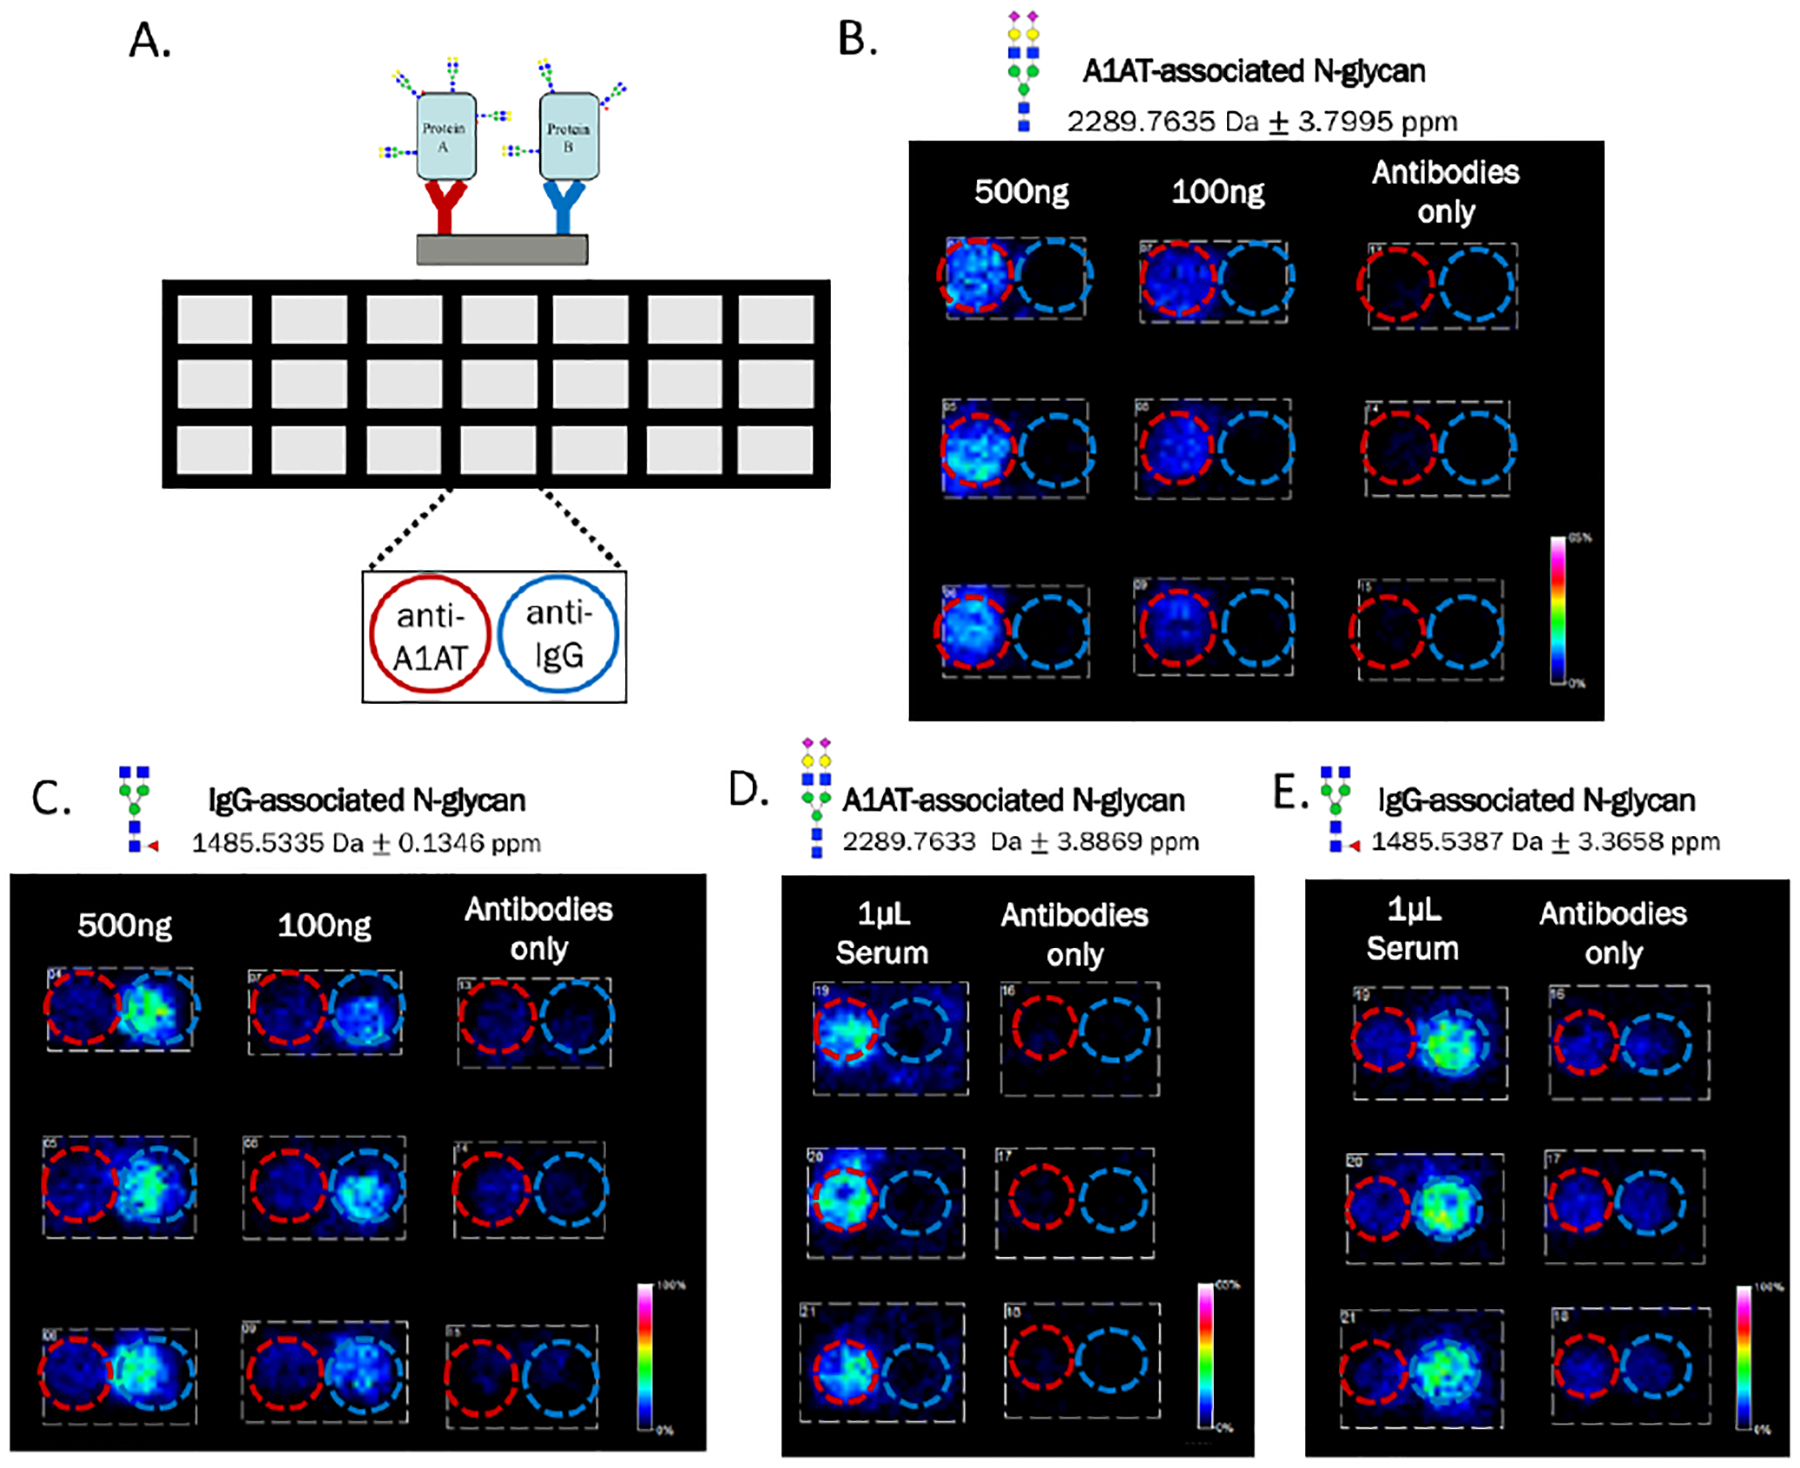
Figure 4.

Side-by-side capture of A1AT and IgG from standard solutions and stock human serum. A) Template of the well module used on nitrocellulose-coated microscope slides. Within each well both anti-A1AT and anti-IgG were spotted adjacently at 200ng per 1.5μL spot. B-C) Solutions containing a mixture of both A1AT and IgG standards were added in triplicate to the two antibodies, red and blue circles added to indicate positions of anti-A1AT and anti-IgG, respectively. An A1AT-associated N-glycan was observed localized to the leftof each well, illustrating specific capture of this glycoprotein by anti-A1AT. An IgG-associated N-glycan was observed localized to the right of each well, illustrating specific capture of this glycoprotein by anti-IgG. D-E) Stock human serum was diluted in PBS and added in triplicate to each well at only 1μL of serum per 100μL well. N-glycan signals from both A1AT and IgG were again detected localized to their respective antibodies. The N-glycan compositions are represented by blue square for N-acetylglucosamine, green circle for mannose, red triangle for fucose, and yellow circle for galactose.
