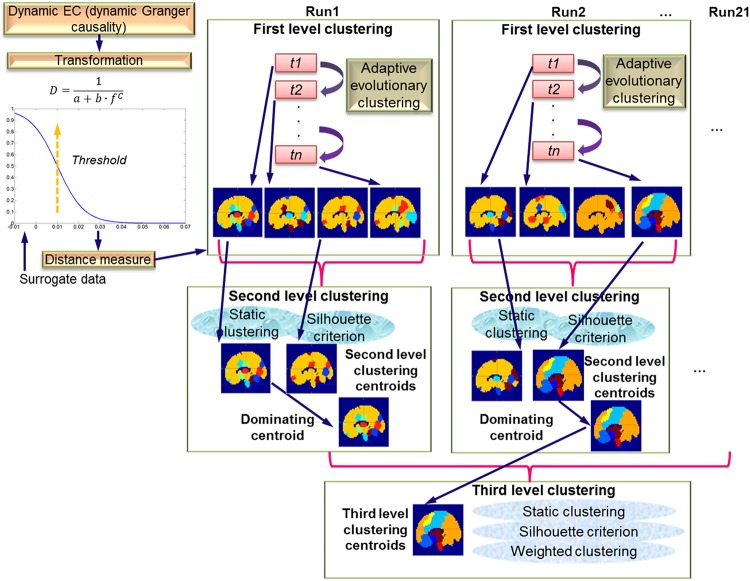
FIGURE 2.
Schematic of the three-level clustering procedure. The top left part shows the transformation of dynamic EC measure (DGC) to a distance measure. Surrogate data were used to determine significant connections. The top right part shows first level clustering using AEC across time instants t1 to tn. The results of the first level clustering are fed into second level clustering, which is static. Here, silhouette criterion is used to determine number of clusters. The dominating centroids from the second level are fed to the third level clustering which is also static and uses the silhouette criterion along with weighted clustering.

