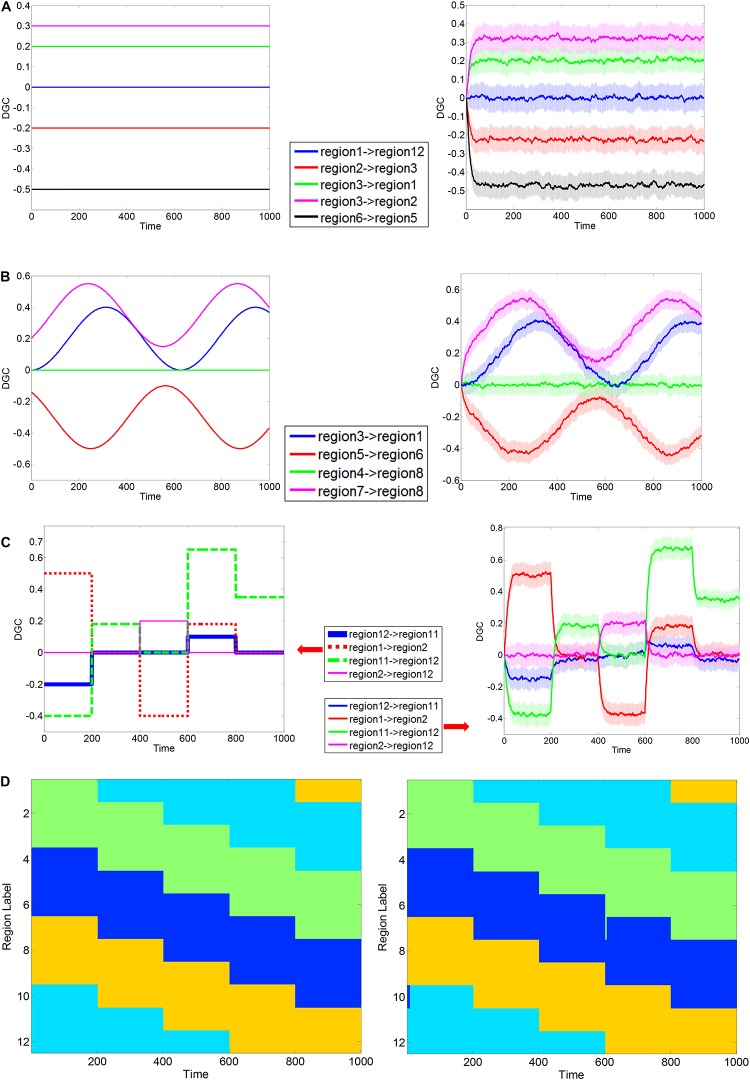
FIGURE 3.
Exemplary simulation result for dynamic Granger causality and first level AEC clustering. MVAR processes of 12 regions were simulated, with a length of 1000 time points. Three scenarios were used to corroborate the validity of formulated DGC. Exemplary ground truth causality of scenario (i) is shown in panel (A) Left, and corresponding mean ± standard deviation (std) of calculated DGCs is shown at Right. Color bands extend from mean–std to mean + std with mean values at the center. Below is same. Exemplary ground truth causality of scenario (ii) is shown in panel (B) Left, and corresponding mean ± standard deviation (std) of calculated DGCs is shown at Right. Exemplary ground truth causality of scenario (iii) is shown in panel (C) Left, and corresponding mean ± standard deviation (std) of calculated DGCs is shown at Right. Exemplary ground truth clustering pattern corresponding to scenario (iii) is shown in panel (D) Left and corresponding clustering result estimated using AEC algorithm is shown at Right. Regions rendered the same color belong to the same cluster.

