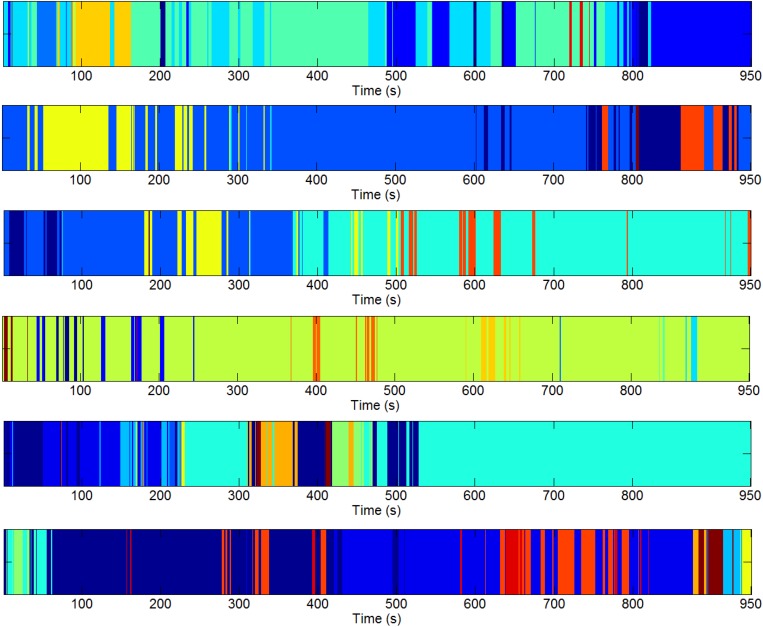
FIGURE 4.
Exemplary second level clustering patterns over time axis from six runs. Along each bar, each color represents one second level cluster and the time instants it occupies indicate the first-level configurations at these time instants belong to it. Different colors represent different second-level clusters. The number of second-level clusters for each bar is 10, 6, 6, 10, 11, 11 (from top to bottom). Please note the same colors in different runs do not mean they are of the same pattern.

