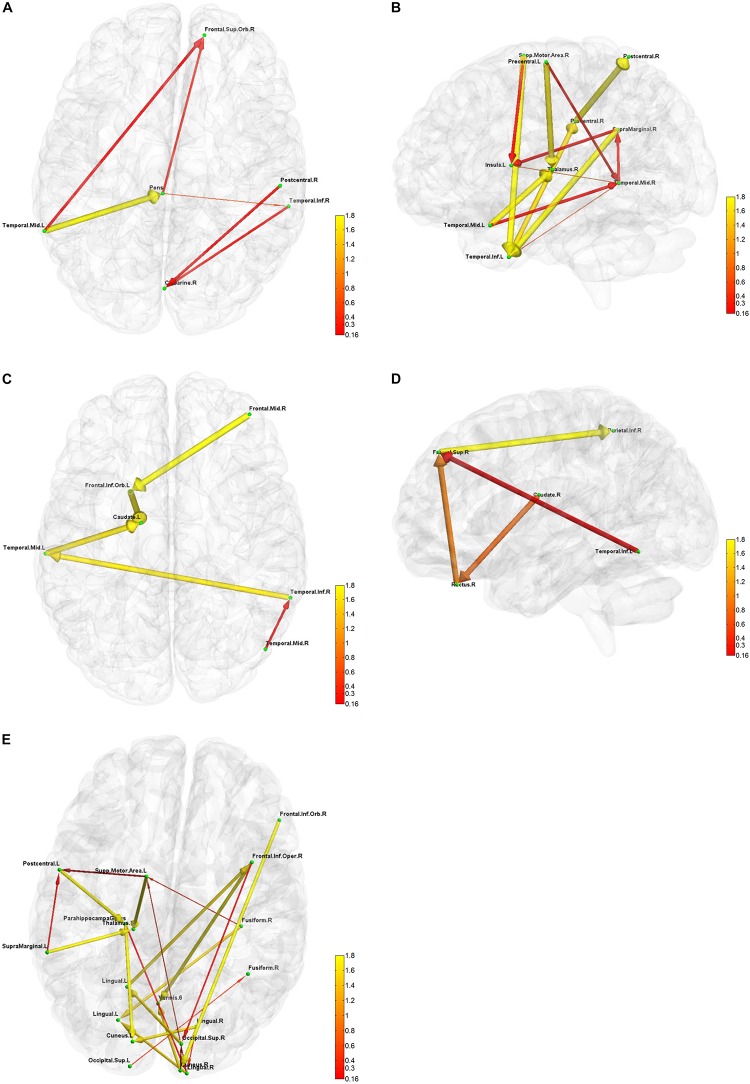
FIGURE 6.
Five directional connectivity networks of the most reproducible third level clustering centroid. In each part figures (A–E), green dots represent the centers of corresponding functionally homogeneous CC200 regions and arrowed paths represent directional connectivity between regions with thickness and color representing the absolute connectivity value. Autumn color map is used with red indicating small value and yellow indicating big value.

