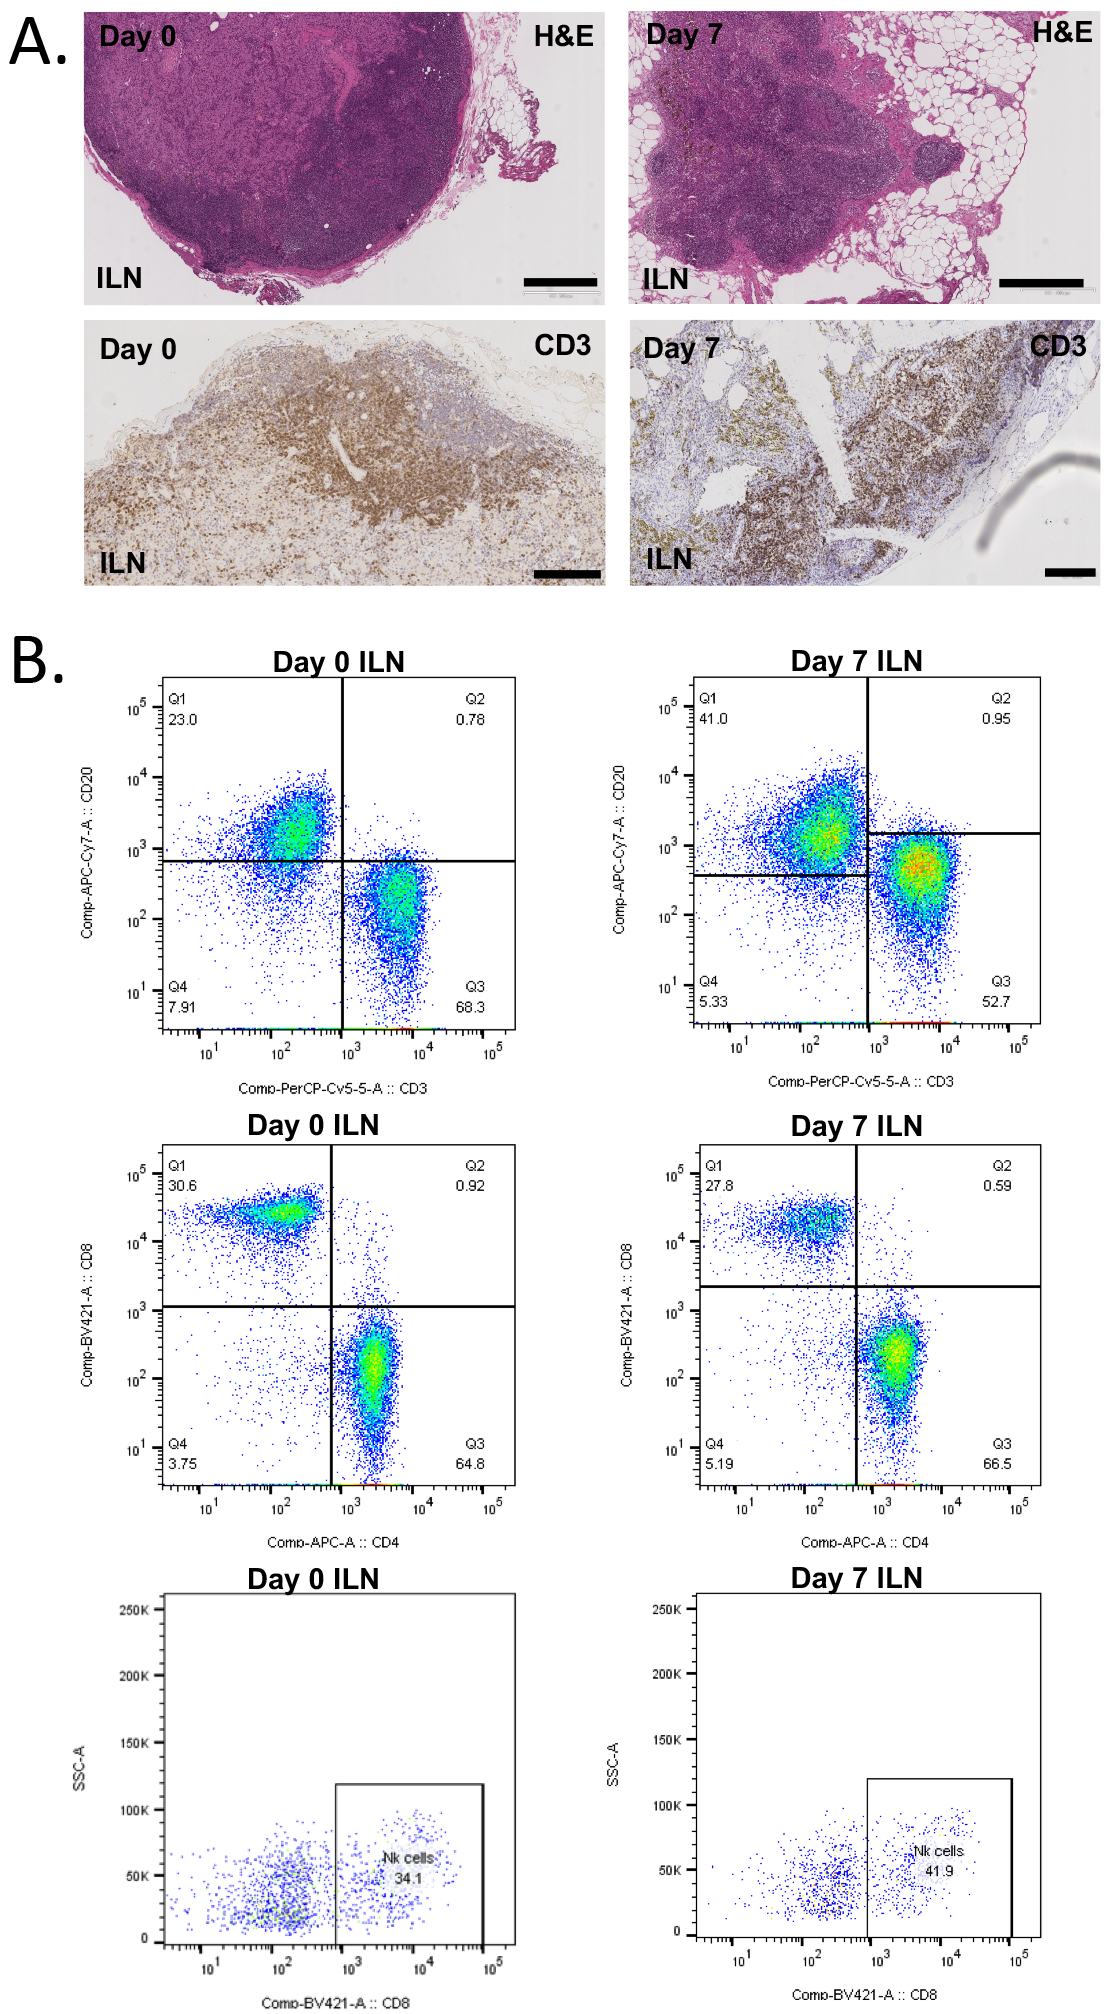
Figure 3. Histomorphological analysis before (n=2) and after (n=4) anti-CD2 treatment (Group A).

A) Light microscopic analysis showing representative iliac lymph node H&E and CD3 staining, suggesting no significant lymphocyte reduction seven days post-treatment. Bar width, 500 um. B) Polychromatic flow cytometric analysis of lymph nodes showing no major treatment impact on CD3+, CD4+, CD8+, and NK cells subpopulations. Abbreviations: BM, bone marrow; ILN, iliac lymph node.
