Figure 5.

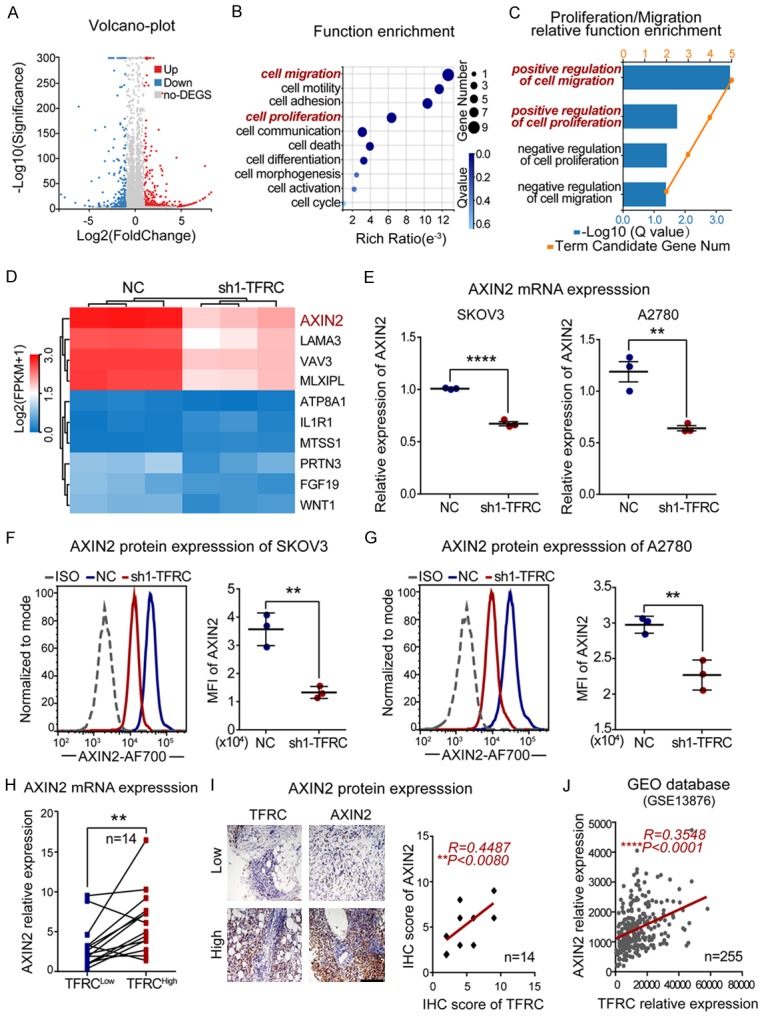
TFRC positively regulates AXIN2 expression in EOC. A. A volcano plot from the RNA-seq analysis shows that the expression of 560 genes was changed (311 downregulated and 249 upregulated) after TFRC knockdown. B. Gene function enrichment analysis was performed with the Gene Ontology (GO) database. C. Genes positively regulating cell proliferation and migration were obviously enriched after TFRC knockdown. D. The heatmap shows that AXIN2 decreased most obviously among the abovementioned genes. E-G. qRT-PCR and flow cytometry results showing AXIN2 mRNA and protein expression in NC- or sh1-TFRC-transfected EOC cells. H. qRT-PCR showing AXIN2 mRNA expression in high TFRC expression tissues (TFRCHigh) and paired low TFRC expression tissues (TFRCLow) from EOC patients. I. Immunohistochemistry showing AXIN2 protein expression in the abovementioned tissues (scale bar, 200 μm) and the statistical analysis results. J. Positive correlation between the expression of TFRC and AXIN2 in ovarian cancer patients from the GEO database (GSE13876). All experiments were performed independently at least three times, and the data are expressed as the mean ± SD. *P<0.05, **P<0.01, ***P<0.001 and ****P<0.0001.
