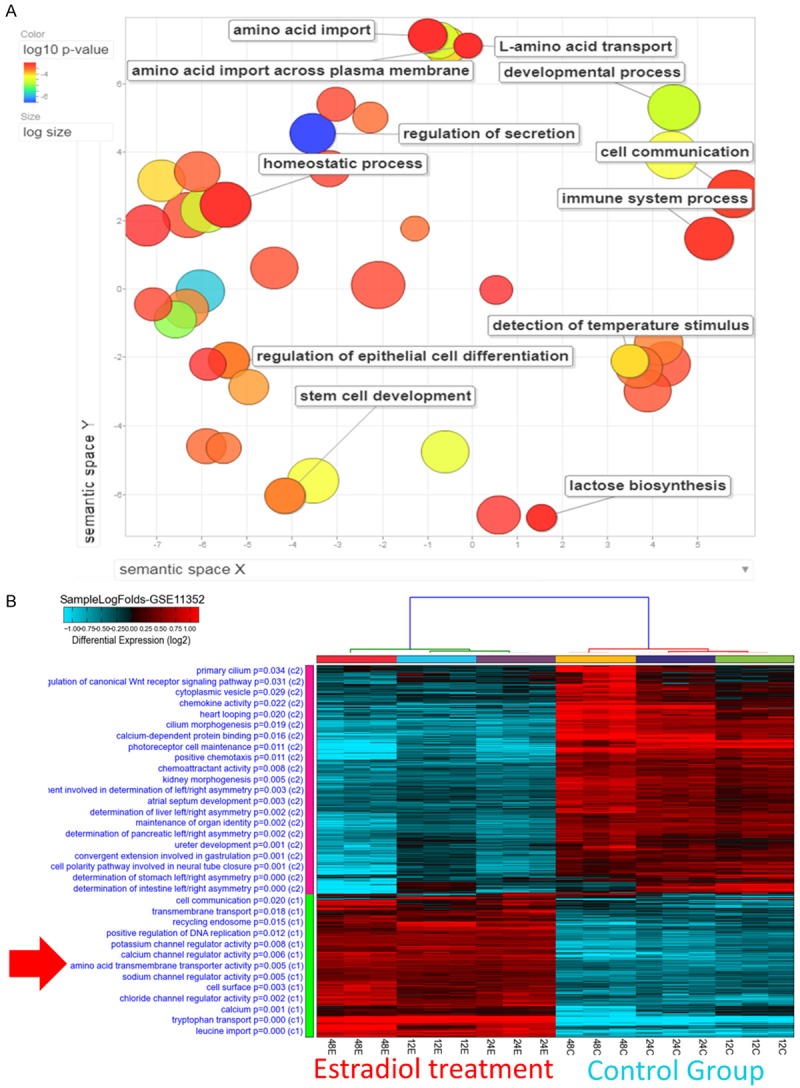
Figure 2.

Gene ontology enrichment analysis using REVIGO and heatmap visualization of GSE11352. A. Significantly enriched GO terms related to biological processes in ER+ vs. ER- patients and in estradiol-treated MCF-7 cells. The scatterplot represents functional clusters, the bubble color indicates the p-values of the GO analysis, and the bubble size indicates the frequency of the GO term in the underlying gene ontology database. B. Analysis of the GSE11352 database revealed that the amino acid transmembrane transporter activity-related pathway appeared significantly in estradiol-treated 12 hours (12E), 24 hours (24E), 48 hours (48E) groups compared with control groups.
