Figure 7.

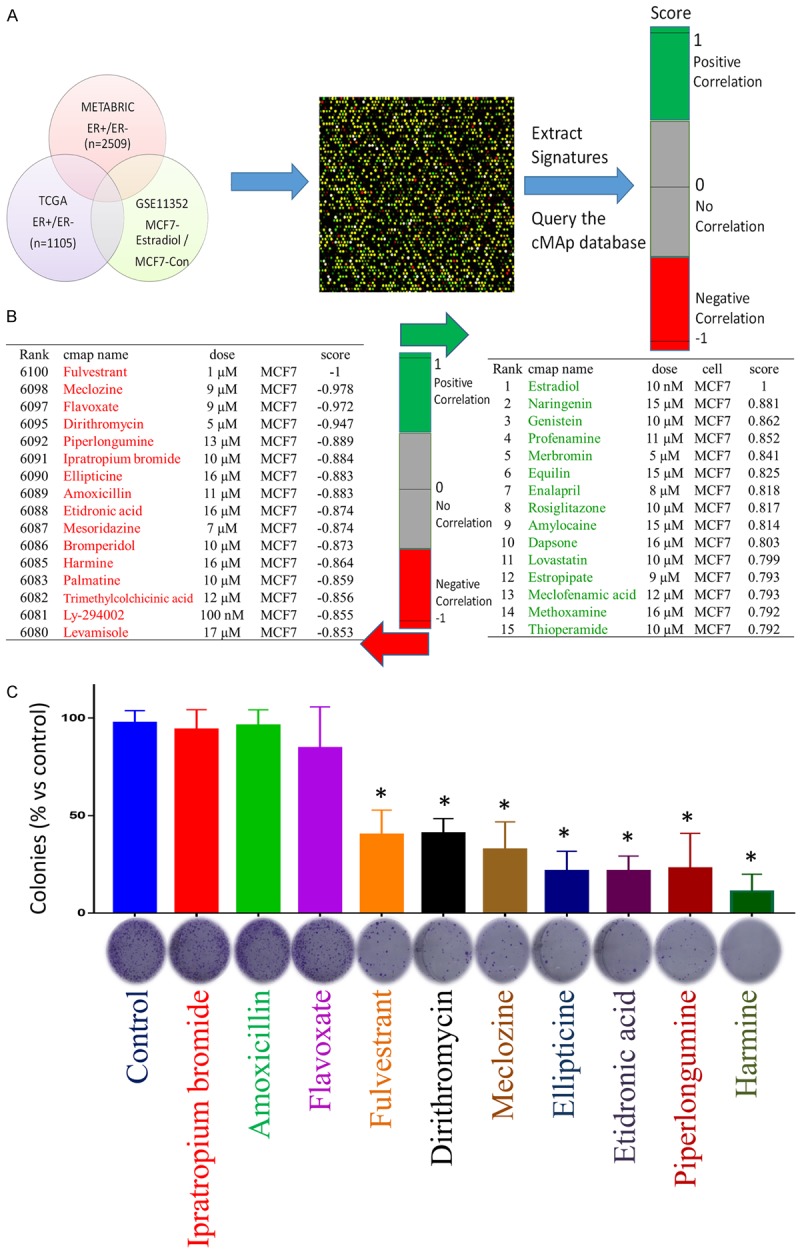
Connectivity map analysis of ER+ versus ER- patients. A. We uploaded the up- and downregulated genes identified in ER+ patients compared with ER- patients according to the METABRIC and TCGA databases and the estradiol-treated dataset into the CMap database to predict potential drug targets. The 15 top and bottom drugs/molecules represented positive and negative correlations, respectively, with ER+ patients. B. CMap analysis identified piperlongumine, ellipticine, etidronic acid, harmine and levamisole as potential therapeutic drugs for ER+ patients. C. Dirithromycin, meclozine, ellipticine, etidronic acid, piperlongumine, harmine treatments resulted in decreased clonogenic propensities during colony formation assays. MCF-7 cells were cultured in six-well plates to allow colony growth, cells were treated with FDA approved drugs for two weeks, and then colonies were stained with crystal violet and counted (n = 3). The graph represents the quantification of crystal violet stained MCF-7 colonies (*P < 0.05 is considered significant).
