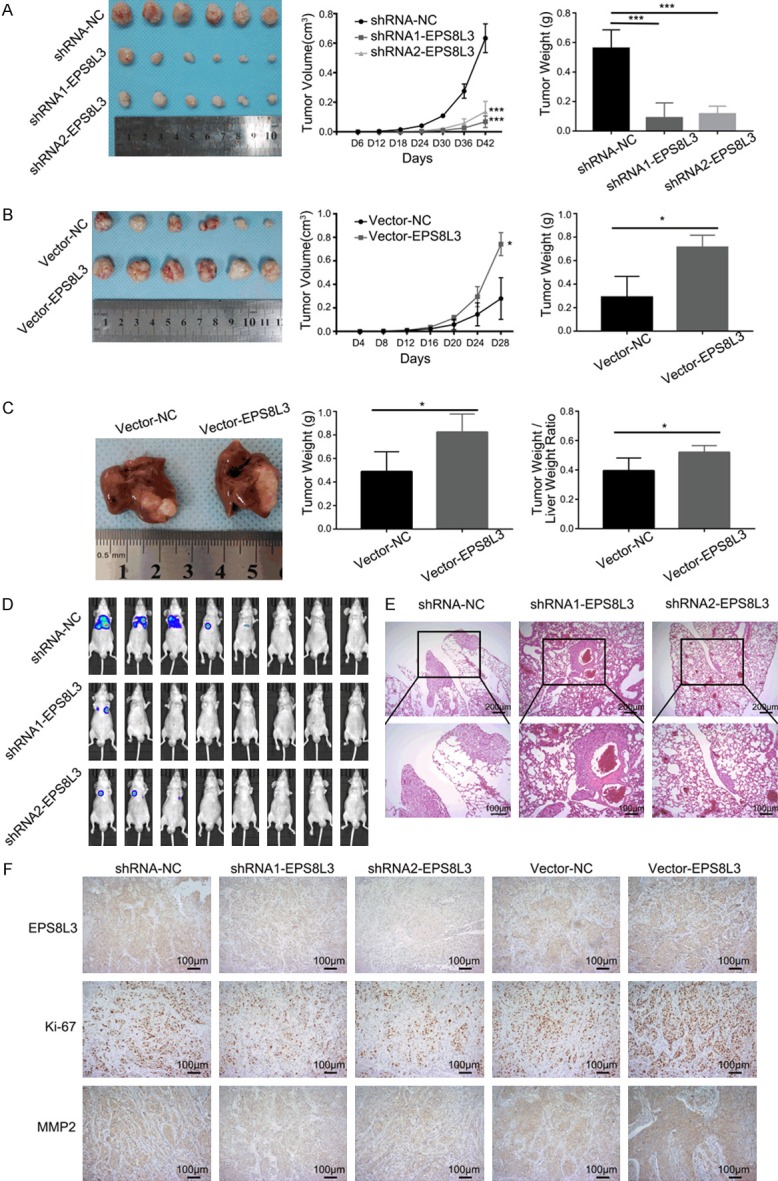
Figure 7.

Changes of proliferation and pulmonary colonization with EPS8L3 alteration. A. Tumor growth of EPS8L3 knockdown HCCLM3 cells and negative control cells was measured every 6 days. Tumors were weighed after excision (N = 6). B. Tumor growth of EPS8L3 overexpressed HCCLM3 cells and negative control cells were measured every 4 days. Tumors were weighed after excision (N = 6). C. Representative tumors from orthotopic transplantation tumor model were shown. Tumors and livers were weighed after excision (N = 5). D. The images of small living animal imaging using D-luciferin sodium salt were shown. (N = 8 per group). E. Representative pictures of pulmonary colonization foci in different groups. F. Representative pictures of IHC staining for different groups were displayed. Results of three independent experiments were shown as mean ± s.d. *: P<0.05, **: P<0.01, ***: P<0.001.
