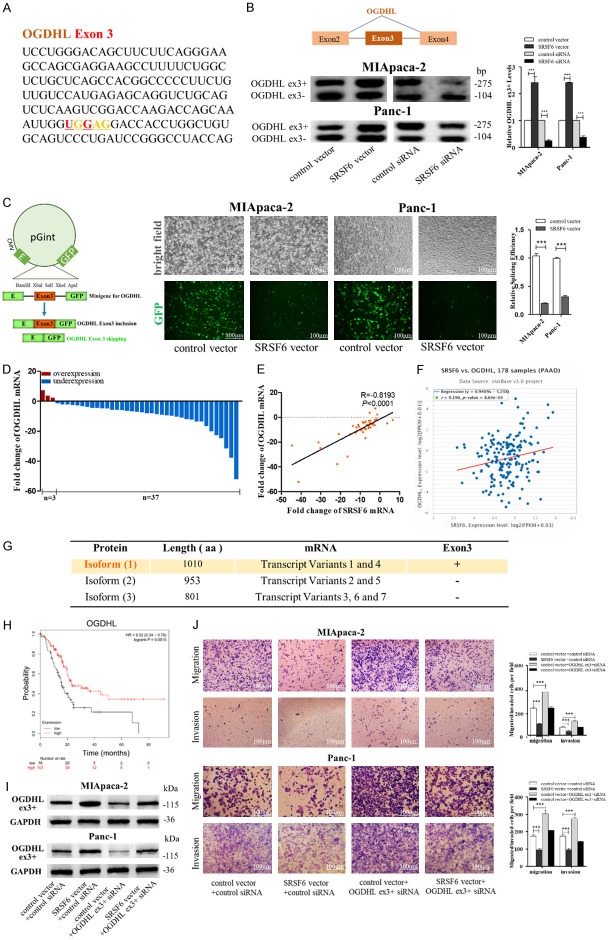
Figure 6.
SRSF6 promotes pancreatic cancer cell migration and invasion through regulating OGDHL alternative splicing. (A) A consensus motif sequence (UGGAG) with predicted SRSF6 binding motif in exon3 of OGDHL. (B) RT-pancreatic cancerR for detecting OGDHL exon3 splicing isoforms expression in MIApaca-2 and Panc-1 cells transfected with control vector, SRSF6 vector, control siRNA or SRSF6 siRNA. (C) Minigene reporter system for detecting OGDHL exon3 splicing (left). The fluorescence signal in the GFP channel represents exon3 splicing efficiency in control and SRSF6 overexpression MIApaca-2 and Panc-1 cells (middle). Quantification of splicing efficiency by measuring the relative expression of intact EGFP transcript (right). (D, E) OGDHL mRNA levels (D) and Pearson’s correlation scatter plot of the fold change of OGDHL and SRSF6 mRNA levels (E) in 40 pairs of human PADC tissues and corresponding adjacent normal tissues. (F) Pearson’s correlation analysis of the fold change of OGDHL mRNA and SRSF6 mRNA in 178 human pancreatic adenocarcinoma (PAAD) tissues by ENCORI database from the TCGA project. (G) Different isoforms of OGDHL from NCBI database. Isoform 1 (1100aa) that contains exon3 is the canonical protein isoform. (H) OGDHL low expression was correlated with a poor survival rate of pancreatic cancer patients (n=177, P<0.01). Data was analyzed using Kaplan Meier Plotter (www.kmplot.com). (I) OGDHL exon3 included (ex3+) protein levels in MIApaca-2 and Panc-1 cells transfected with or without SRSF6 vector and with or without OGDHL (ex3+) siRNA detected by western blotting. (J) Migration and invasion of MIApaca-2 cells (upper) and Panc-1 cells (lower) transfected with or without SRSF6 vector and with or without OGDHL (ex3+) siRNA detected by transwell migration and invasion assay. Scale bar, 100 μm. All data are shown as the mean ± SEM. ***P<0.001.

