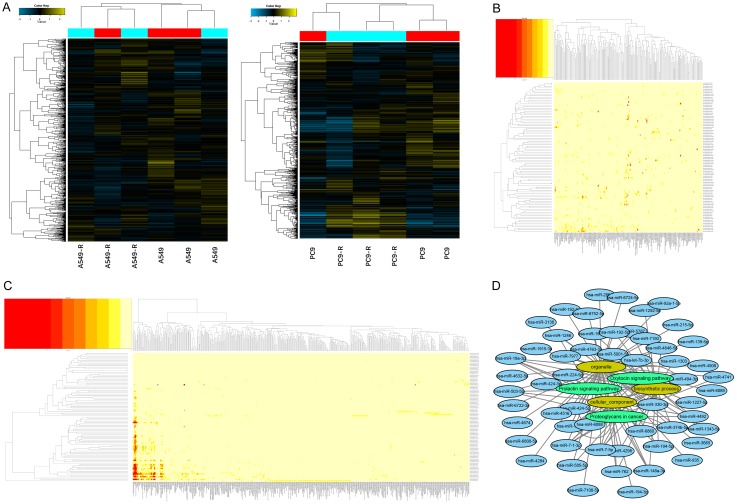
Figure 1.
Screening of differentially expressed miRNAs identified by microarray and functional annotation. A. Hierarchical clustering results of the microarray-verified differentially expressed miRNAs between RR and their parental cell lines. B, C. GO and KEGG analyses of differentially expressed miRNAs. D. Top three enriched GO (yellow) and KEGG (green) pathway results and their correlated differentially expressed miRNAs (blue).

