
Figure 5.
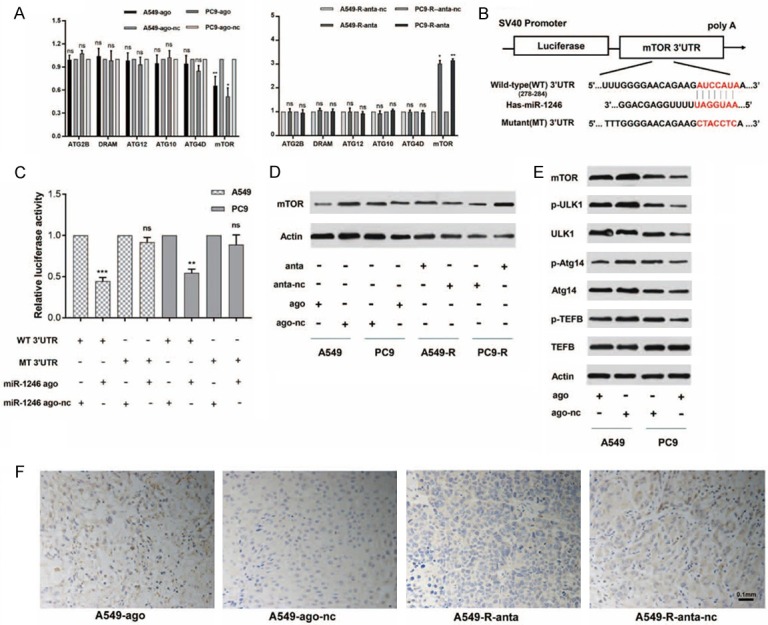
MiR-1246 targets the mTOR axis. A. The relative mRNA expression of predicted targets was detected by qRT-PCR (n=3) in miR-1246 upregulated or downregulated NSCLC cells. Actin was used as an internal reference. Data are presented as the mean ± SD. *, P<0.05; **, P<0.01; ns, no significant. B. The dual-luciferase reporter containing the mTOR 3’UTR is shown. It displays the predicted binding sequences between wild-type 3’UTR and miR-1246, as well as the mutant 3’UTR. C. Luciferase activity assays (n=3) were performed after transfection of miR-1246 agomir or nc into A549 and PC9 cells. The luciferase activity of the agomir-nc transfected cells was set as 1. Data are presented as the mean ± SD. *, P<0.05; **, P<0.01; ns, no significant. D. A549 and PC9 cells were transfected with miR-1246 agomir or nc. The protein expression of mTOR, p-ULK1, ULK1, p-Atg14, Atg14, p-TEFB, and TEFB were measured by Western blot (n=3). Actin was used as an internal reference. E. A549 and PC9 cells were transfected with miR-1246 agomir or nc, while A549-R and PC9-R cells were transfected with miR-1246 antagomir or nc. Then, mTOR expression was determined at the protein level by Western blot analysis (n=3). F. The differential expression of mTOR between xenograft tumour tissues treated with miR-1246 agomir and nc was detected by immunohistochemistry. n=6 per group. Ago: agomir, anta: antagomir, nc: negative control.