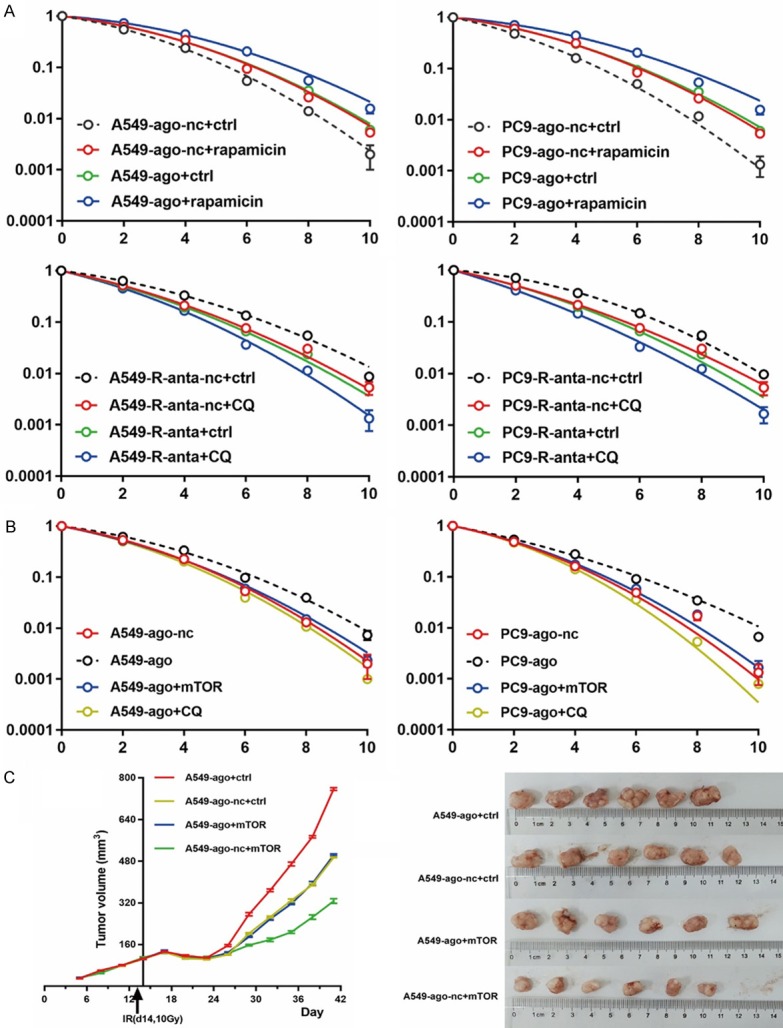
Figure 6.

MiR-1246 promotes resistance of NSCLC cells to irradiation by mTOR-mediated inhibition of autophagy activation. (B) NSCLC cells were transfected with miR-1246 agomir, nc, or mTOR plasmid, or they were treated with CQ (10 μmol/L) following irradiation. Survival curves were generated for both (A) and (B) groups. n=3 per group. Data are presented as the mean ± SD. (C) Nude mice were subcutaneously injected with tumour cells transfected with an mTOR expression plasmid or control plasmid. When the average tumour volume reached approximately 100 mm3, they were treated with agomir or nc and a single 10 Gy dose one day later. Tumour volume data were recorded and then they were radiated and removed as mentioned above; n=6 per group. Student’s t-test was used for differential analysis, and data are presented as the mean ± SD. Ago: agomir, anta: antagomir, nc: negative control, ctrl: control.
