
Figure 10.
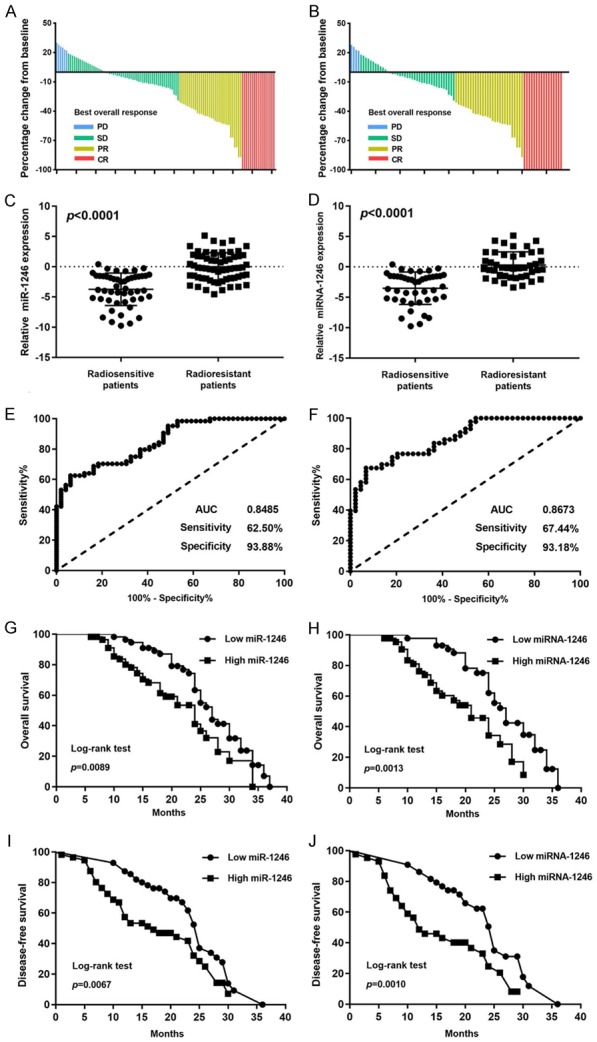
miR-1246 as a biomarker for predicting radiosensitivity and prognosis in NSCLC patients. (A, B) The baseline percentage of NSCLC patients’ best overall response is shown. PD: Progressive Disease; SD: Stable Disease; PR: Partial Response CR: Complete Response. The relative miR-1246 expression level was detected by qRT-PCR in the serum from 112 NSCLC patients (C) and the FFPE tissue from 87 NSCLC patients (D). Receiver operating characteristic (ROC) curve analysis was conducted based on miR-1246 expression in the serum from 112 NSCLC patients (E) and the FFPE tissues from 87 NSCLC patients (F). The AUC, sensitivity, and specifcity values are given in the graph. AUC: Area Under Curve. Kaplan-Meier analysis of overall survival (OS) was performed based on miR-1246 expression in the serum from 112 NSCLC patients (G) and the FFPE tissue from 87 NSCLC patients (H). Kaplan-Meier analysis of disease-free survival (DFS) was performed based on miR-1246 expression in the serum from 112 NSCLC patients (I) and the FFPE tissue from 87 NSCLC patients (J). The median was used as the cut-off value to distinguish between low and high expression of miR-1246.