Figure 8.
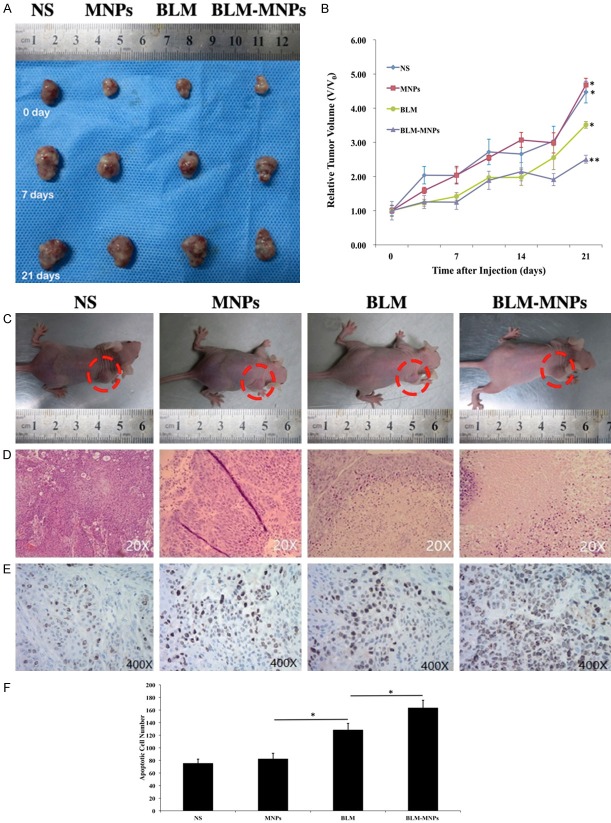
Inhibitory effect of BLM-MNPs on tumors under the control of magnetic field in vivo. A. Representative photographs of tumor from different groups at the beginning, 7th, 21th day, respectively; B. Relative tumor volume of different groups of mice after various treatments indicated (6 mice per group): mice injected with NS, MNPs, BLM and BLM-MNPs (*P<0.05); C. Representative photographs of the nude mice from different groups after curing for 14 days (red circle showed the tumors); D. H&E-stained tumor slices collected from different groups of mice on the following day after various treatments; E. Tunnel assay further confirmed the antitumor potency of BLM-MNPs with target (Blue: normal nucleus; brown: apoptosis positive cell nucleus). F. Tumors of mice treated with BLM-MNPs with target showed apoptosis at high proportion compared with other groups, even for the group treated with BLM (*P<0.05).

