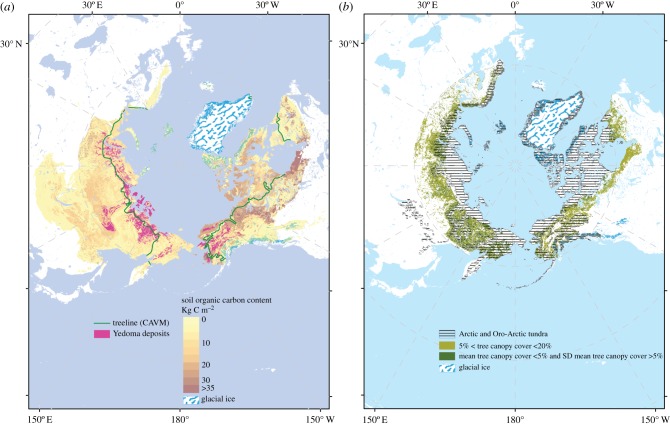
Figure 1.
(a) Shades of brown: estimated soil organic carbon storage (kg C m−2) in the 0–300 cm depth range of the northern circumpolar permafrost region. Data normalized for total polygon area (including non-soil areas) [25]; pink regions: areas of deep, organic-rich Yedoma deposits [26]; Green line: tundra/boreal forest treeline [27]. (b) Dashed area: areas of treeless Arctic tundra—any land north of the Arctic treeline [27]—and ‘Oro-Arctic’ areas [28]; shades of green: map of selected areas with defined tree canopy cover over the circumpolar taiga–tundra ecotone. Derived from the 500-m MODIS Vegetation Continuous Fields product as averaged over 6 years from 2000 to 2005 and processed as described in [29]. It depicts patches of low tree canopy cover indicative of the forest–tundra ecotone. Map covers 60° N–70° N (Eurasia) and 50° N–70° N (North America). Map projection: Azimuthal Equidistant, geodetic datum: WGS84.

