
Figure 3.
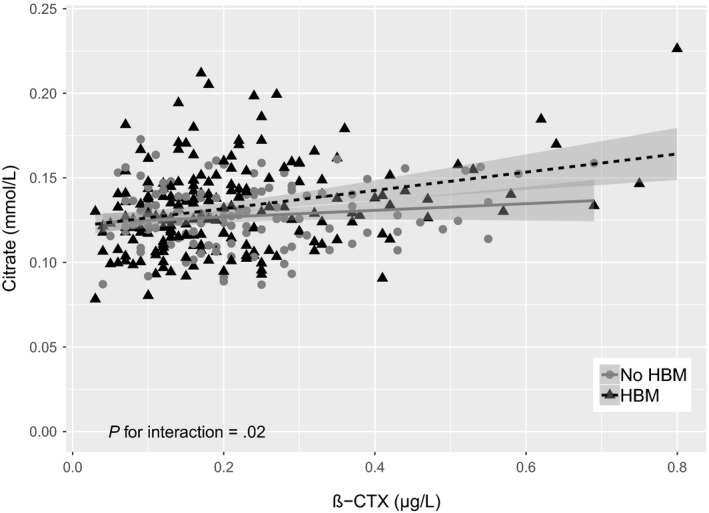
Associations between β‐CTX and citrate in individuals with HBM and family members with normal BMD. NHBM = 198 and NRelatives = 122. Regression lines represent the unadjusted associations between β‐CTX and citrate (βHBM = 0.055 [0.026, 0.083] and βNo HBM = 0.022 [−0.003, 0.046] where β represents the increase in mmol/L of citrate per 1 µg/L increase in β‐CTX. After adjusting for age, sex, height, weight, menopause, bisphosphonate use and oral glucocorticoid use (model 3), β‐CTX was still associated with citrate in individuals with HBM (0.050 [95% CI 0.024, 0.076], P = 1.71 × 10⁻⁴) but no association was seen in relatives with normal BMD (8.03 × 10⁻⁴ [−0.024, 0.026], P = .95)