
Figure 2. The expression of miR-193-3p and its clinical significance in HCC.
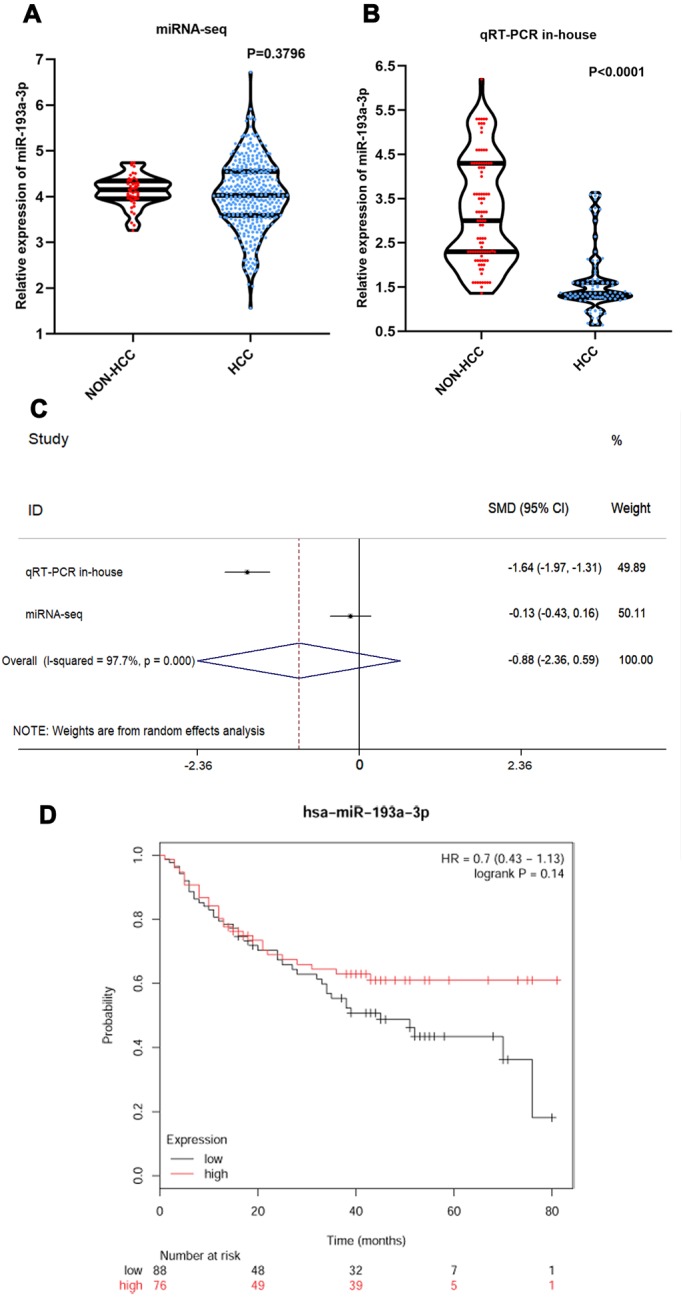
(A) Violin plot of miR-193a-3p expression in HCC based on TCGA database. (B) Violin plot of miR-193a-3p expression in HCC based on in-house qRT-PCR. (C) Forest plot of miR-193a-3p expression in HCC (random-effects model). SMD < 0 indicates that miR-193-3p was downregulated in HCC tissues as compared with non-tumor tissues. (D) Overall survival (OS) analysis in Kaplan-Meier Plotter online website.