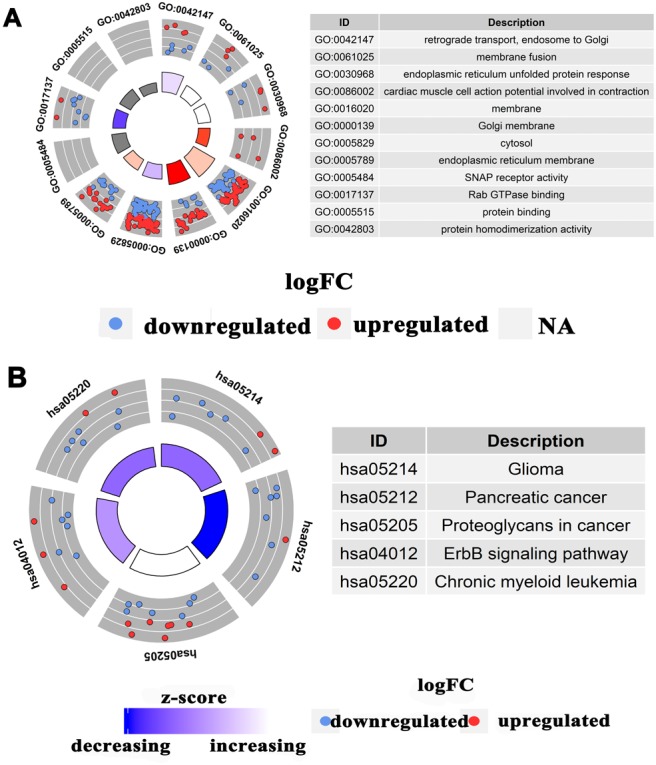
Figure 4. Concentric circle diagram of the GO analysis and KEGG pathways.

(A) Concentric circle diagram of the GO analysis. The nodes in the concentric circle represent the co-expression genes clustered in the GO annotations. (B) Concentric circle graph of KEGG pathways. The larger and darker areas in the inner circle are more abundant.
