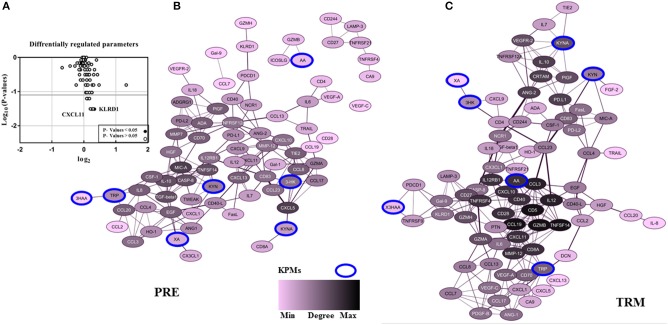
Figure 3.
The pattern of CMM plasma protein and KPMs in PRE-and TRM groups. (A) differentially regulated proteins in the CMM patient PRE vs. TRM based on PEA measurement, (B) correlation networks between all PRE, and (C) TRM CMM patients network (cut-off: Spearman correlation ≥ 0.5). Nodes represents a molecular feature, and an edge specifies a statistically significant Spearman correlation between two markers (nodes).

