Table 3.
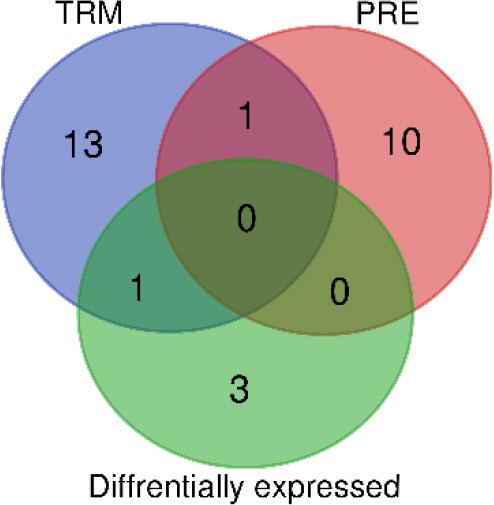
(A) Network characteristics (B) the overlapping between the hubs with differentially expressed parameters (PEA & LC-MS/MS) in PRE and TRM groups.
| Total (N = 12) | PRE (N = 5) | TRM (N = 5) | ||
|---|---|---|---|---|
| (A) | ||||
| Correlation network based on original variables | ||||
| Number of nodes | 81 | 82 | ||
| Number of edges | 178 | 253 | ||
| Median degree | 4 | 6 | ||
| Average clustering coefficient | 0.46 | 0.51 | ||
| Hubs (degree centrality) | MIC-A(0.13) | GZMB(0.04) | ||
| CASP8(0.06) | CD5(0.04) | |||
| TNFSF14(0.06) | CCL19(0.04) | |||
| MMP7(0.09) | TNFSF14(0.04) | |||
| CD70(0.09) | IL-12(0.14) | |||
| CXCL13(0.11) | CCL3(0.14) | |||
| IL-10(0.001) | IL12RB1(0.12) | |||
| TGFB1(0.06) | TNFRSF4(0.08) | |||
| CCL8(0.05) | CXCL10(0.03) | |||
| TIE2(0.05) | CD28(0.03) | |||
| CXCL5(0.13) | CD40(0.03) | |||
| AA(0.03) | ||||
| MMP12(0.04) | ||||
| CD8A(0.04) | ||||
| CXCL11(0.04) | ||||
| Names | PRE | TRM | Diffrentially expressed | |
| Total | 11 | 15 | 4 | |
| (B) | ||||
| Elements | TIE2 | IL-12 | 3-HK |  |
| TGFB1 | CD40 | KYN | ||
| CXCL13 | MMP-12 | KLRD1 | ||
| CD70 | TNFRSF4 | CXCL11 | ||
| CASP8 | AA | |||
| CCL8 | CCL19 | |||
| MIC-A | CXCL10 | |||
| MMP7 | GZMB | |||
| IL-10 | IL12RB1 | |||
| CXCL5 | CD5 | |||
| TNFSF14 | CD28 | |||
| CCL3 | ||||
| CD8A | ||||
| TNFSF14 | ||||
| CXCL11 | ||||
Numbers are given of overlapping parameters compared to the total number. Venn diagram represents all shared and all unique markers in each group.
