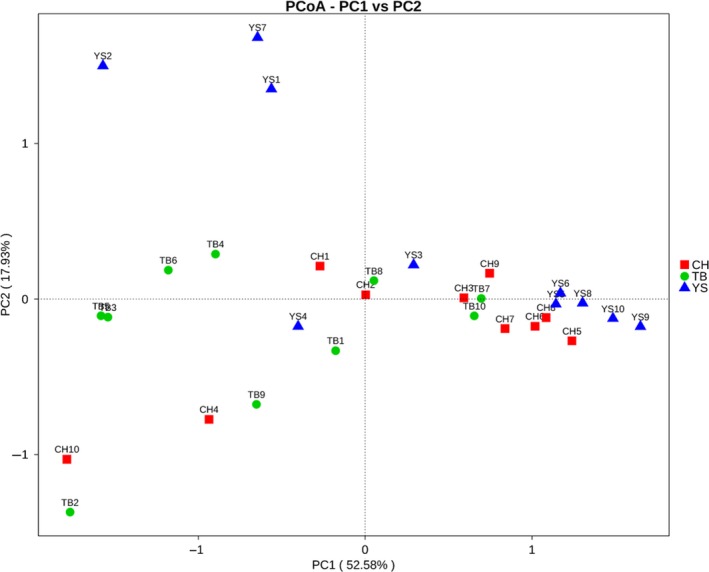
Figure 1.

Principal coordinate analysis (PCoA) of fungal community structures of the faecal microbiota of three groups based on the weighted Unifrac distance metric. The fungal communities from the faecal samples of pigs in the three different groups are significantly different (P = 0.001). Each symbol represents one sample, and symbols with same colour mean samples from the same group.
