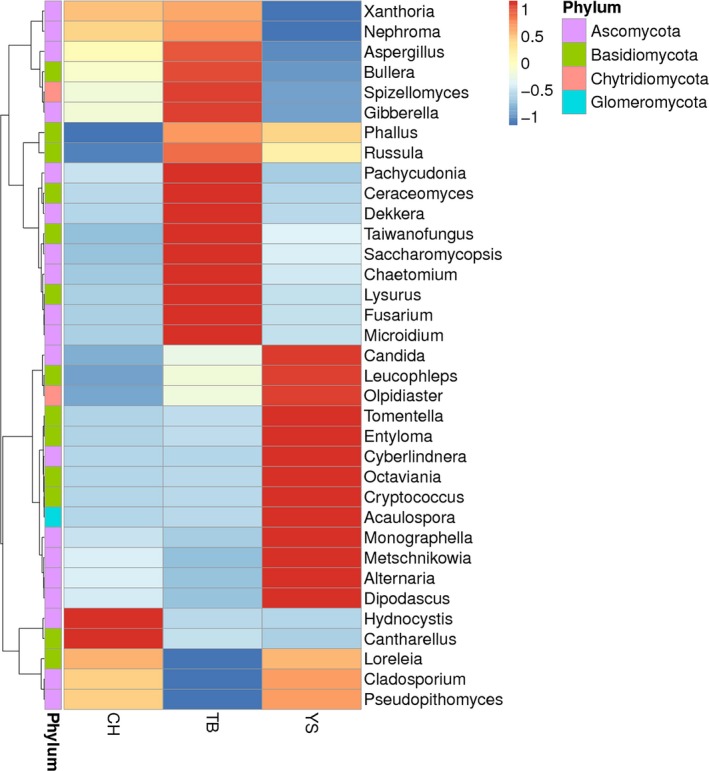
Figure 3.

Heatmap distribution of OTUs for samples in the three groups. OTUs are arranged in rows and are clustered on the vertical axis (y‐axis). Samples are arranged vertically and are on the horizontal axis (x‐axis). Clustering was done using Phylotrac’s heatmap option with Pearson correlations and complete lineage algorithms.
