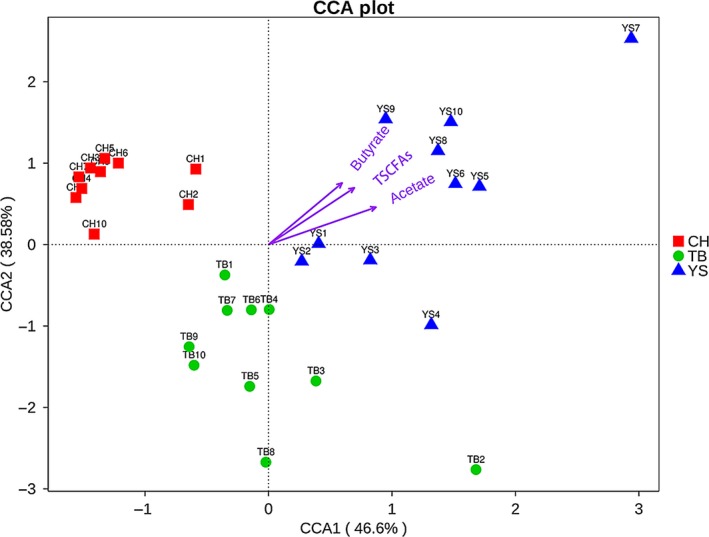
Figure 4.

The relationship between the fungal community and the environmental factor in the faecal samples of pigs calculated using the canonical correspondence analysis (CCA). Each symbol represents one group. Each of the arrow line in the CCA chart represents the corresponding environmental factor (acetate, propionate and butyrate), and the length of each arrow line represents the degree of correlation between each environmental factor and the fungal community. An acute angle between two arrow lines indicates a positive correlation between the two corresponding environmental factors, conversely an obtuse angle indicates a negative correlation. Axis 1 and 2 contributed 85.1% of the total variation, with 46.6% for CCA1 and 38.5% for CCA2. All samples obtained from CH pigs distribute in the fourth quadrant, while samples from YS pigs distribute in both the first and second quadrant, and those from the TB pigs distribute in both the second and third quadrant. The correlation of each SCFA with the fungal community structure in the faeces of the animals shows in the following order: acetate > butyrate > propionate.
