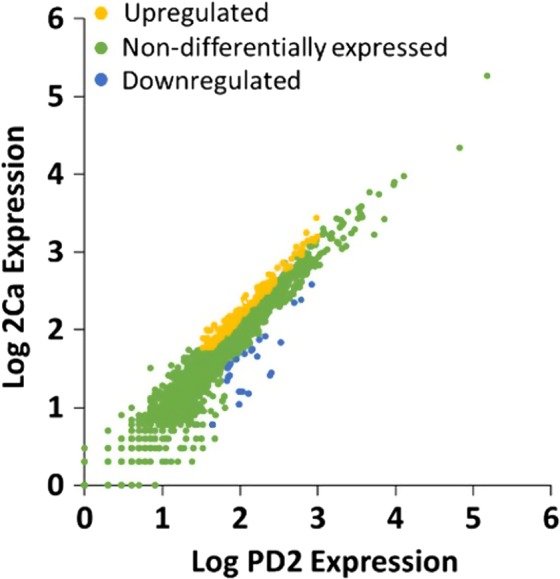
Figure 2.

Scatter plots of log gene expression from X. fastidiosa cells cultured in MC (2Ca vs. PD2) as computed from the RNA‐Seq data. Genes significantly differentially expressed in 2Ca/PD2 (1.5‐fold change; q < 0.05) are indicated in yellow (upregulation) or blue (downregulation). Non‐differentially expressed genes are indicated in green.
