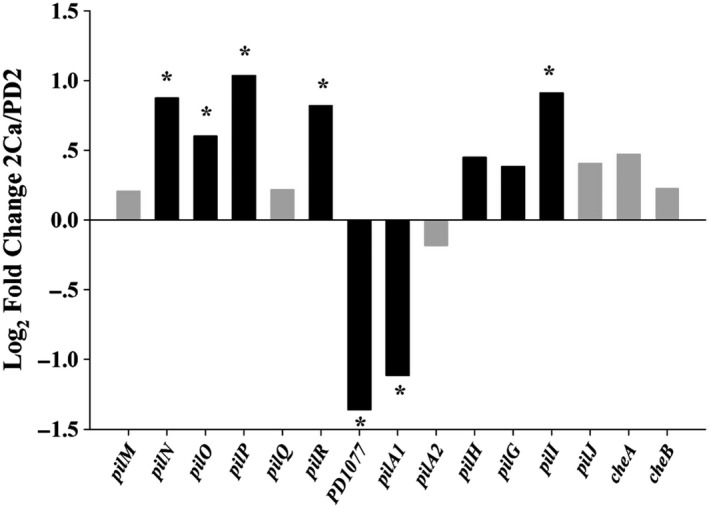
Figure 3.

Expression changes of selected type IV pili genes in X. fastidiosa cultured in microfluidic chamber. Each bar shows the log2 fold change of gene expression in 2Ca versus PD2 as computed from the RNA‐Seq data. Black bars indicate q < 0.05. Asterisk indicates fold changes > 1.5.
