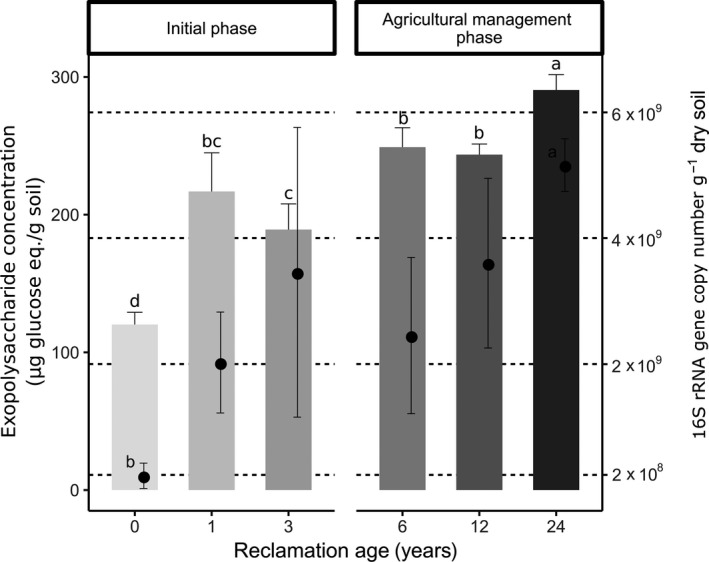
Figure 1.

Concentration of exopolysaccharides and bacterial abundance in the two reclamation phases. Exopolysaccharide contents are shown as bars with values presented on the left y‐axis, while the abundance of bacteria is depicted as points with values presented on the right y‐axis. Bars and points represent the means of triplicates, and error bars represent standard deviations. The concentrations of exopolysaccharides were calculated as equivalents of glucose used as the standard, per gram of dry soil. Bacterial abundances were calculated as 16S rRNA gene copy numbers per gram of dry soil. Letters above bars and points represent pairwise comparisons adjusted with the Benjamini–Hochberg correction showing the significant differences between reclamation ages after a robust ANOVA test with trimmed means (P < 0.05).
