
Figure 4.
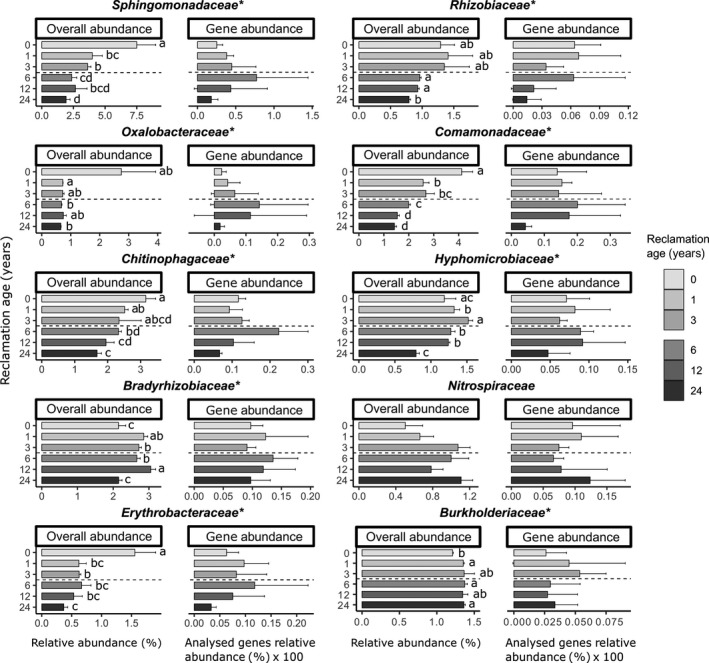
Comparison of relative abundances of particular highly abundant bacterial families with their potential to produce exopolysaccharides and lipopolysaccharides. Bars represent the means of triplicates per reclamation age with a standard deviation. Marked families (*) were found to be significantly influenced by reclamation age in their relative abundance (Robust ANOVA with trimmed means, P < 0.05), and letters next to the bars represent pairwise comparisons adjusted with the Benjamini–Hochberg correction. Relative abundances of exopolysaccharide and lipopolysaccharide genes are shown as percentages multiplied by 100.