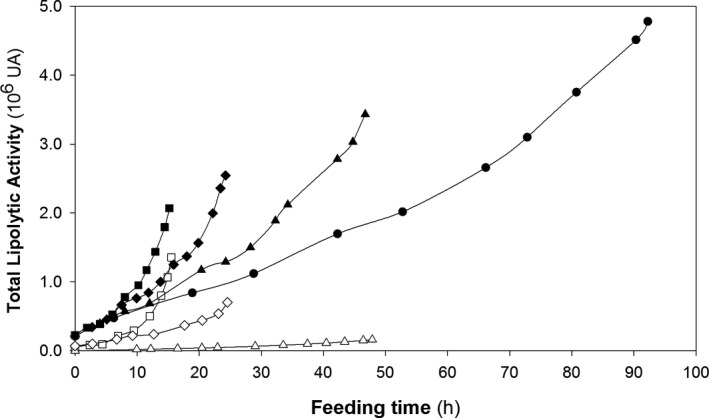
Figure 5.

Variation of the total lipolytic activity in fed‐batch cultures at different specific growth rates (µ) with the multicopy (black symbols) and single‐copy clones (white symbols). Specific growth rates: (●) 0.025 h–1, (▲) 0.05 h–1, (♦) 0.10 h–1, (■) 0.15 h–1, (Δ) 0.05 h–1, (◊) 0.10 h–1 and (□) 0.15 h–1.
