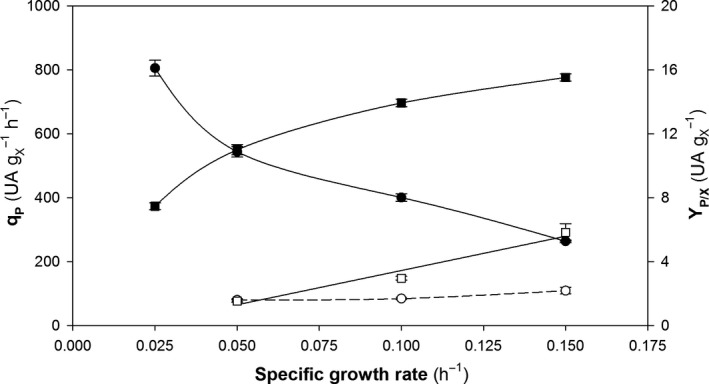
Figure 6.

Production parameters for fed‐batch cultures at different specific growth rates of the multicopy (black symbols) and single‐copy clones (white symbols). (■,) Specific product generation rate (q P); (●, ○) overall product‐to‐biomass yield coefficient (Y P/X). Error bars show SE from regression analysis.
