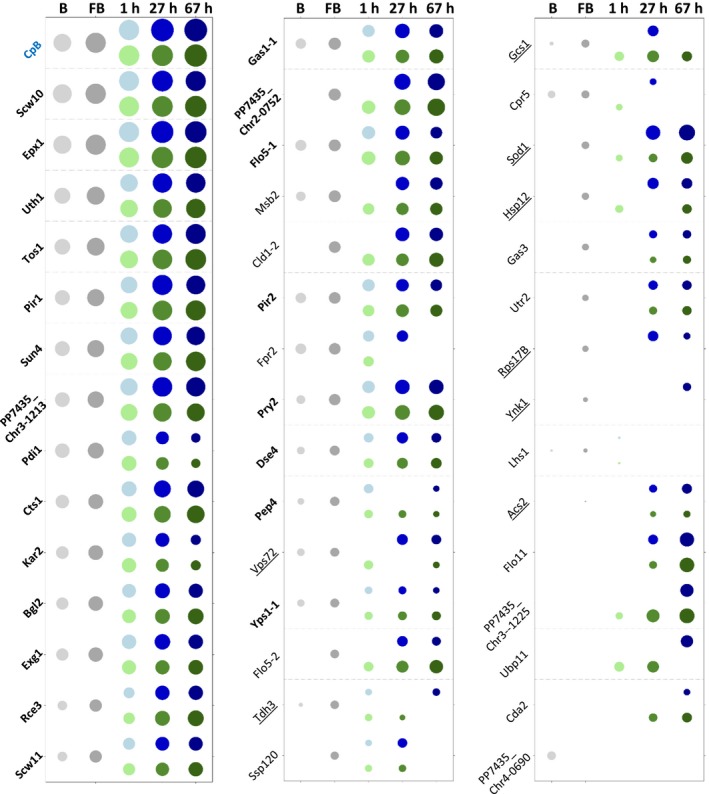
Figure 5.

Relative quantities of proteins present in the supernatants of the methanol‐ and glucose‐based fed‐batch (FB) processes using MaxQuant. Bubble size indicates protein abundance in the respective culture condition related to the protein in lowest detectable concentration (Acs2 in the glycerol FB) in a log scale sorted for their abundance in the glycerol FB sample. The bubble colour is representing the glycerol batch (B) in light grey, the glycerol FB in dark grey, the methanol FB in shades of blue and the glucose FB in shades of green. Proteins of the core secretome are written in bold letters, and underlined proteins do not contain a predicted signal peptide.
