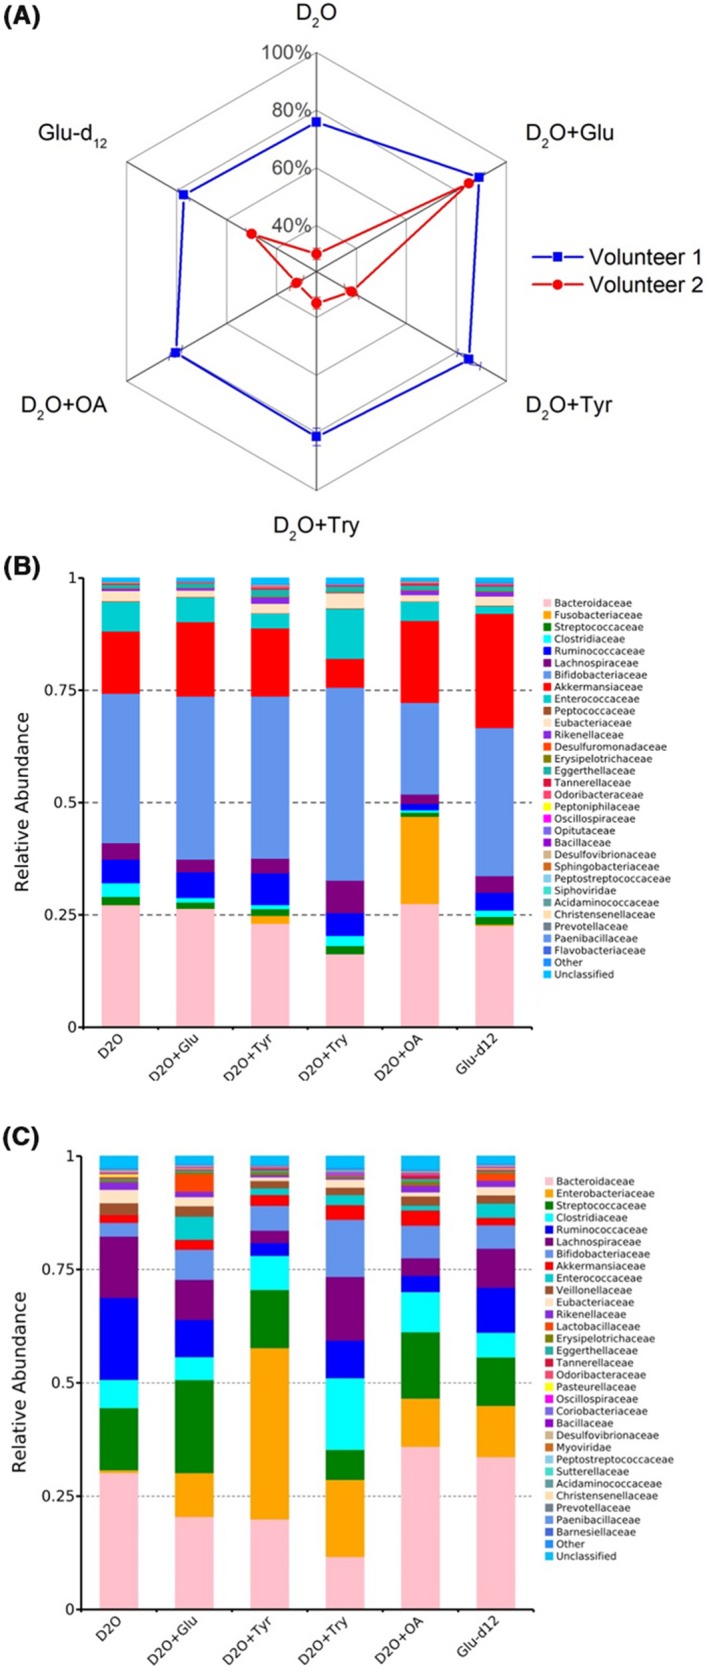
Figure 2.

A. Percentages of the active intestinal microbiota from two healthy individuals in response to different nutrients measured by Raman–DIP. For each condition, three replicates were taken with 50–80 cells per sample. The error bar represents standard deviation of three replicates.
B. and C. Structures of the microbial community (top 30 at family level) of two healthy individuals with different nutrient supplements (E.coli was excluded).
