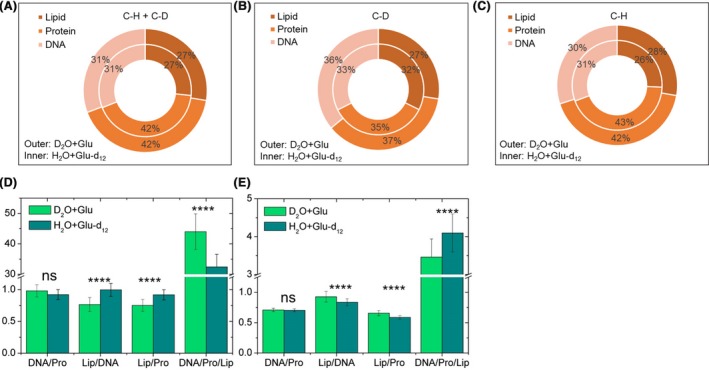
Figure 4.

Relative intensities of lipid, protein and DNA were quantified by calculating (A) the sum of the C–D and the C–H band, (B) the C–D band (2109, 2160 and 2220 cm−1) and (C) the C–H band (2874, 2928 and 2962 cm−1). The ratios of the three components in (D) the C–D band and (E) the C–H band. Student t‐test was used to indicate statistical differences between glucose and glucose‐d12 conditions, in which ns indicates non‐significant, *P < 0.05, **P < 0.01, ***P < 0.001, ****P < 0.0001.
