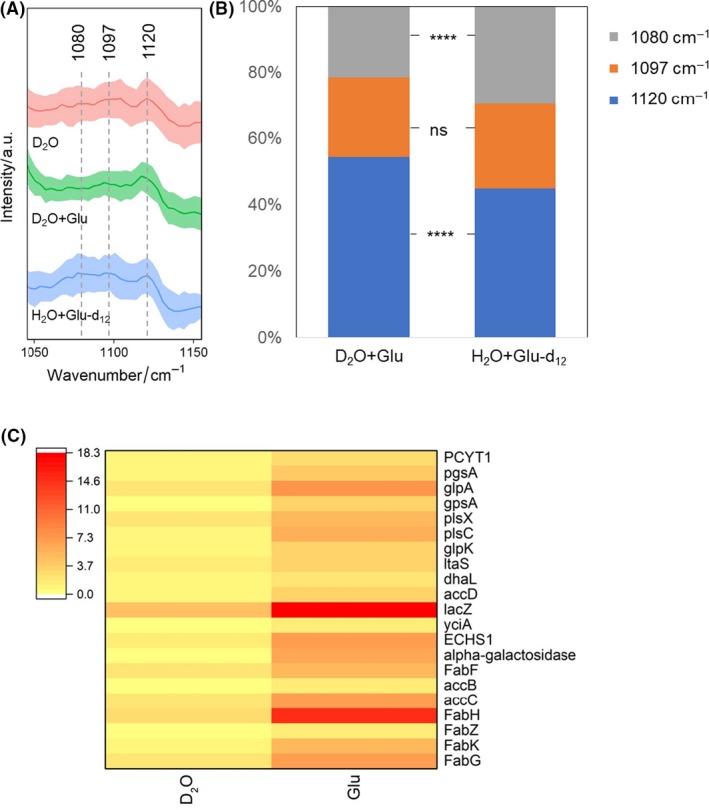
Figure 5.

A. Enlarged view of the Raman band of saturated fatty acid shifted from 1120 to 1080 cm−1 in the fingerprint region of microbiota cultured in situ with D2O, D2O + 10 mM glucose or H2O + 10 mM glucose‐d12.
B. Quantification of 1120, 1097 and 1180 cm−1 band s. Student t‐test was used to indicate statistical differences between glucose and glucose‐d12, in which ns indicates non‐significant, *P < 0.05, **P < 0.01, ***P < 0.001, ****P < 0.0001.
C. Abundance of gene types associated with lipid synthesis pathways.
