
Figure 3.
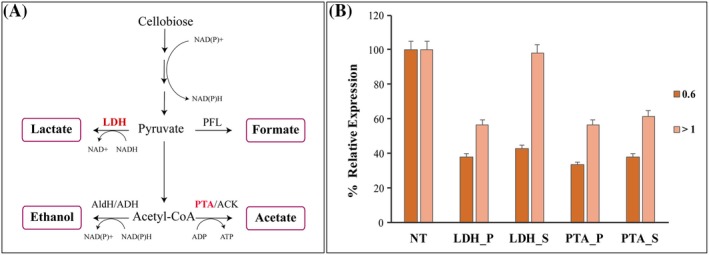
Effective suppression of ldh and pta genes by CRISPRi. A. Metabolic pathway representation of H. thermocellum DSM1313 for conversion of cellobiose to ethanol and major organic acids production. (ACK, acetate kinase; ADH, alcohol dehydrogenase; AldH, aldehyde dehydrogenase; LDH, lactate dehydrogenase; PFL, pyruvate‐formate lyase; and PTA, phosphotransacetylase). B. Relative ldh and pta gene expression was evaluated using qRT‐PCR in comparison with control non‐targeting (NT) at an OD600 – 0.6 and 1.0 respectively; positive silencing transformants for ldh gene referred as ldh_P – targeting the promoter, ldh _S – targeting the start of the gene; positive silencing transformants for pta gene referred as pta_P – targeting the promoter, pta_S – targeting the start of the gene. H. thermocellum DSM 1313 cells were transformed with both non‐targeting pThermoCas9i_NT and targeting pThermoCas9i_ldh/pta plasmids. The TmR colonies of both the non‐targeting and targeting plasmids were transferred to 50 ml CP (5 g l−1 yeast extract) medium containing 6 µg ml−1 TmR and cultured to OD600 ~ 0.6 and > 1.0, and 5 ml cells were sampled for qRT‐PCR analysis with technical triplicates. The expression levels were normalized to those in the NT control. Data represent the mean values of three biological replicates and the standard deviation (SD). The level of significance of the differences when results were compared was estimated by means of analysis of variance (ANOVA), with α = 0.05.