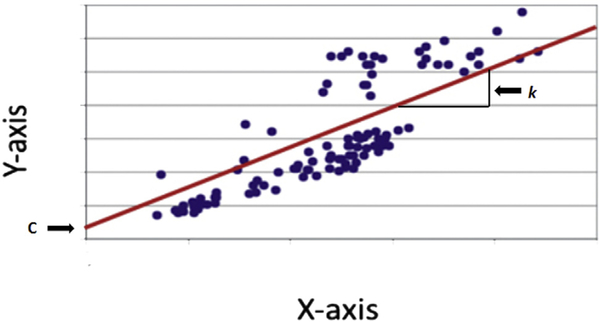
Fig 1.
Scatter plot. The scatter plot is also called the x-y graph. Each observation has 2 coordinates. The x-coordinate is the predictor variable and defines the distance from the y-axis. Vice versa, the y-coordinate is the outcome variable and defines the distance from the x-axis. The regression line can often be visualized and should pass through the middle; alternatively a statistical software program can be used to draw the regression line. The regression line quantifies an inexact relationship meaning that the 2 variable are related to each other. The correlation coefficient measures the strength of the relationship between the 2 variables and falls between (−)1 and (+)1. A correlation coefficient of 0 means that there is no relationship at all and the observations scatter all over the graph. If the correlation coefficient is 1, all observations are perfectly linear and located directly on the regression line. With correlation coefficients between 0 and 1, the regression line represents the best fit. The variable k is the gradient and simply describes the steepness of the regression line; c describes where the regression line crosses the y–axis, which is not always at 0.

