
Figure 1.
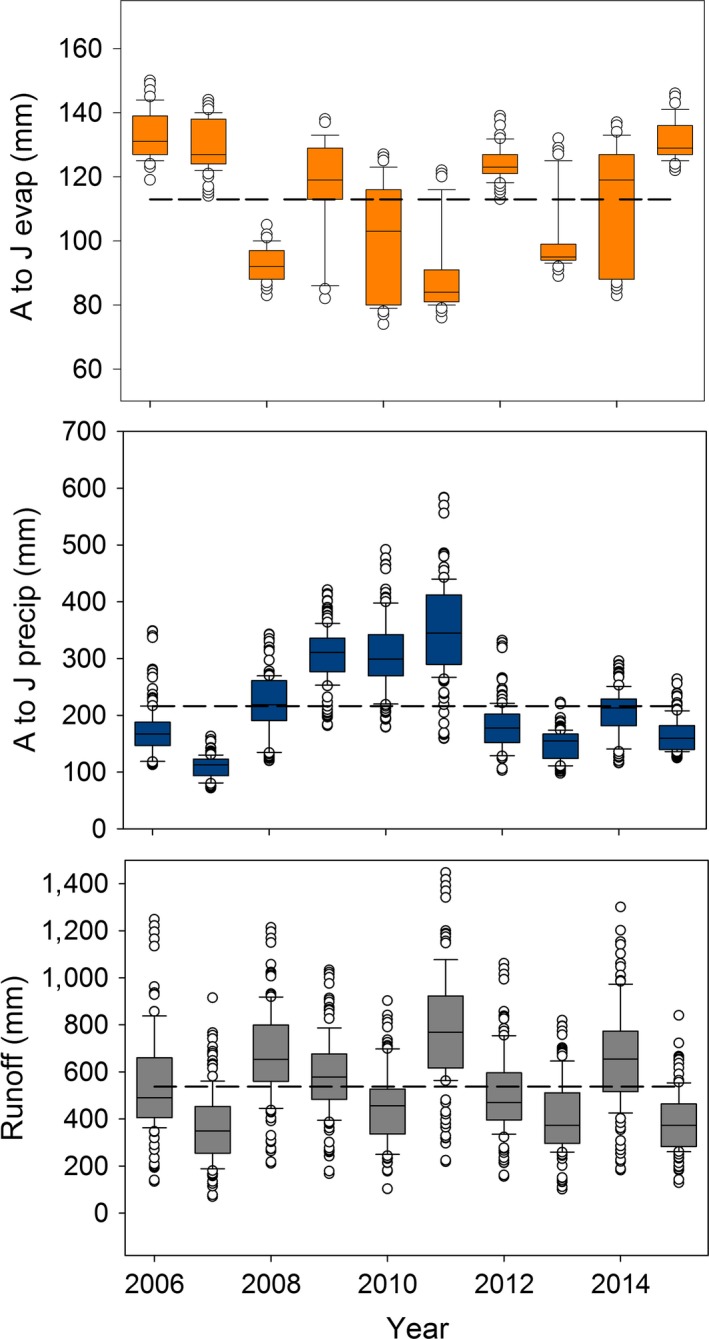
Annual variation in climate drivers for all monitored wetlands. Precipitation (precip; mm) and evapotranspiration (evap; mm) were summed over three months between April and June (A to J). Runoff was estimated on an annual basis. The dashed line represents the 10‐year average across all sites. The box plots demonstrate the interquartile range with the mid line indicating the median. Whiskers represent the 10th and 90th percentiles of the distribution.