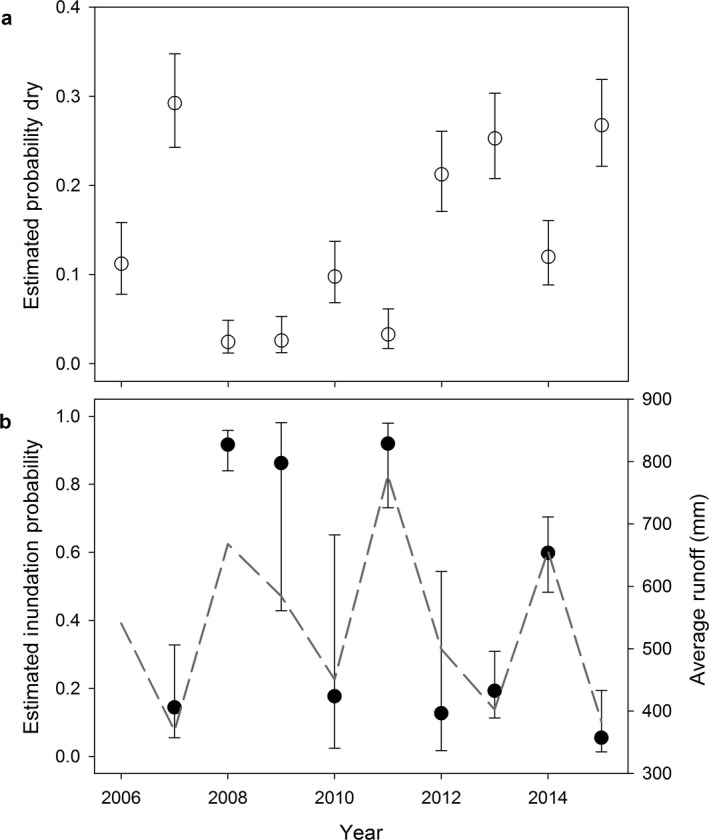
Figure 2.

(a) Derived estimates of the proportion of dry wetlands (i.e., probability [m = 0]) over a 10‐yr period in Yellowstone and Grand Teton National Parks and (b) estimated annual inundation probabilities of dry wetlands in the prior year, ψ0(t). Estimates are given for the best supported model, using the average precipitation value across wetlands and years from Program MARK. The average runoff by year for surveyed sites (dashed line) is also given as a means for distinguishing “dry” vs. “wet” years. Error bars indicate approximate 95% confidence intervals.
