. 2019 Aug 20;10(40):9351–9357. doi: 10.1039/c9sc03781k

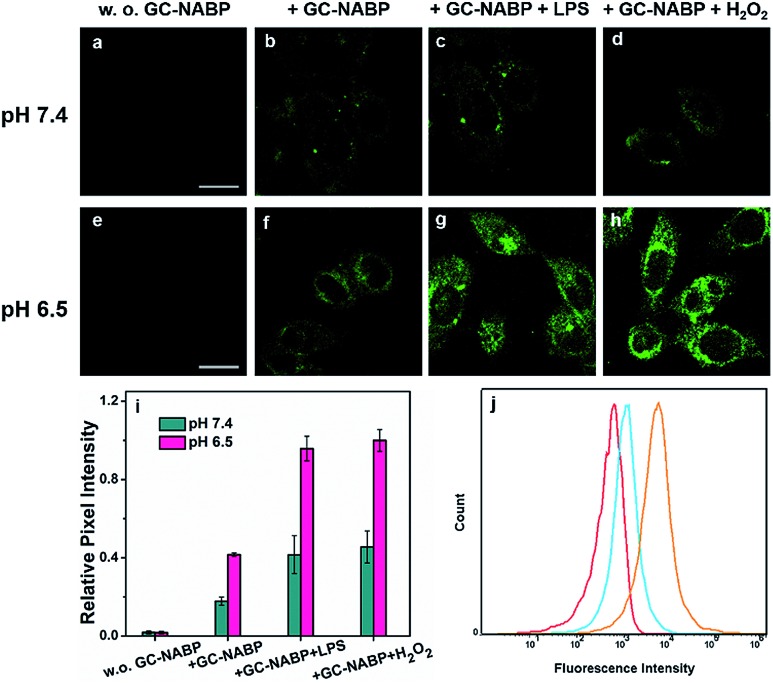
Fig. 3. (a–h) TPM images of HepG2 cells incubated at two different pH values. Control images of HepG2 cells treated without the GC-NABP nanoprobe at pH 7.4 (a) and pH 6.5 (e). HepG2 cells treated with only the GC–NABP nanoprobe at pH 7.4 (b) and pH 6.5 (f). HepG2 cells stimulated with LPS and then treated with the GC–NABP nanoprobe at pH 7.4 (c) and pH 6.5 (g). HepG2 cells treated with the GC–NABP nanoprobe and H2O2 at pH 7.4 (d) and pH 6.5 (h). (i) Relative pixel fluorescence intensity of HepG2 images. (j) Flow cytometry of Hela cells incubated with the GC–NABP nanoprobe at different pH values for 4 h, and then treated with H2O2. Red: control; blue: pH 7.4; orange: pH 6.5. Scale bar: 20 μm.

Fig. 3